Li Chang, WES Research & Advisory Services, Yoko Kono
 [1]
[1]Click to expand [1]
In 2013, more than one in three international students in the U.S. were enrolled in science, technology, engineering, and mathematics (STEM), according to the Institute of International Education (IIE).1 [2] This translates to over 300,000 international students, a 27 percent increase from five years ago (237,000).
STEM innovation, a key driver of national economic growth [3], has increased significantly the global demand for STEM talent. In the midst of this worldwide competition for talent, higher education institutions (HEIs), as incubators of innovation, aim to attract more STEM students to their institutions. Despite their global dominance in international rankings in the STEM fields, HEIs in the U.S. have seen varying degrees of growth in international STEM enrollments by location and institutional type. For instance, just 20 HEIs account for nearly 30 percent of the total international enrollment of STEM students.
In light of increasing worldwide competition and the imbalanced enrollment growth among states and institutions within the U.S., the following questions arise: How can U.S. HEIs maintain and grow their attractiveness to international students interested in STEM studies? What are the best countries from which to recruit international STEM students? And what are some effective recruitment strategies to attract those students?
Last year, we concluded that international student mobility to the U.S. is led by growth at the undergraduate level in the fields of business, with intensive English programs [4] also gaining significantly in popularity at universities and third-party providers around the U.S. We believe these trends will continue in the years ahead. Building on last year’s report, we are now taking a more in-depth look at STEM enrollments this year, with a number of national and global trends making the current environment a particularly opportune time for U.S. institutions to recruit international students to STEM programs. These include:
- The availability of government scholarships from students’ home countries, exemplified by the recent surge of students from Brazil [5] and Saudi Arabia [6].
- A policy environment focused on attracting STEM students, as exemplified by the extension of Optional Practical Training (OPT) to a maximum of 29 months [7] for international graduates with STEM degrees, and by the apparent desire of both the U.S. House of Representatives and Congress to increase the number of work visas issued to STEM graduates from U.S. universities, under proposed immigration reform bills.
- The current demand for STEM students in the global labor market. Students graduating from these fields have promising employment prospects both overseas and domestically.
This article aims to help HEIs understand the megatrends in STEM mobility, in order to help develop an effective and targeted strategy to recruit international students to STEM programs. The following sections provide a comparative view of international enrollment trends in STEM fields in four major English-language destination countries: U.S., UK, Australia and Canada. We then examine primary STEM markets pursuant to international recruitment in the U.S., and conclude with insights on how best to recruit international students.
Worldwide Competition for STEM Talent
In the past few years, divergent enrollment trends have been observed in the U.S., UK, Australia and Canada.2 [8] Due, in part, to the effects of tightened visa policies in the UK and Australia, both countries saw overall declines in international student numbers in 2013, by two [9] and three percent [10] respectively, from the previous year. Specifically for STEM fields, the total number of international students in Australia in 2013 (69,459) is slightly lower than a year ago (69,520). Likewise, the UK witnessed a two percent decline in international STEM enrollments as compared to 2012.
In contrast, Canada has seen continuous growth in recent years as a result of immigration-friendly visa policies. Nearly 47,000 international students enrolled in STEM fields in 2012, representing one-fourth of the total international student population. As compared to a 51 percent increase of international students in all programs, enrollments in STEM programs grew 60 percent from 2008 to 2012. The newly launched Federal Skilled Workers Program [11], which attracts skilled workers in STEM and finance fields [12], looks likely to contribute to increased international enrollment growth in Canada.
Without doubt, the U.S. leads in popularity of STEM programs among globally mobile students. The sheer enrollment of international students in STEM fields in the U.S. (300,898) in 2013 is more than the aggregate of that in the UK (111,795), Australia (69,459) and Canada (46,863). The share of STEM enrollments among all the international students in the U.S. (37%) is the largest, followed by the UK (26%), Canada (25%) and Australia (21%).
However, the biggest challenge for U.S. HEIs is the disproportionate enrollment of international STEM students by location and institutional type. It raises the concern that smaller or less research-focused institutions may face significant barriers to recruiting STEM students overseas. This highlights the need to develop a solid understanding of current mobility trends.
International STEM Graduate Students in the U.S.
As noted above, STEM fields combine to draw the largest pool of international students to the U.S. IIE data show that 37 percent of international students at U.S. institutions studied in STEM programs in 2013. Due to the lack of comprehensive data on international STEM enrollments at the undergraduate level, we examined international students at the graduate level, which highlight the geographical imbalance of STEM enrollments in the U.S.:3 [13]
- Mirroring overall international enrollment trends, nearly one out of three international graduate students (30%) studied a STEM subject in Fall 2011 in one of the three states (California, New York and Texas).
- Ten states in the U.S hosted over three-fifths (61%) of international graduate students in STEM fields in Fall 2011, indicating a need and opportunity to increase the diversity of geographic locations for international enrollments.
- Likewise, nearly three out of 10 international graduate students (29%) in STEM fields are enrolled in one of 20 institutions in the U.S. Institutions with smaller enrollments of this student segment need and have room to increase their international student population.
- Public institutions account for 71 percent of international graduate students in STEM fields. Doctorate-granting universities (66%), including those classified as ‘very high research activity,’ ‘high research activity’ and ‘doctoral universities’ are the biggest draw, suggesting a recruiting challenge at less research-focused institutions.
Comparisons within STEM reveal that while international first-time graduate enrollment in life science fields dropped by three percent in Fall 2013 from the previous year; enrollments in engineering and physical & earth sciences have increased at a faster rate—17 percent and 18 percent [14] respectively–than other fields, as reported by the Council of Graduate Schools (CGS).4 [15]
At the same time, with the lackluster growth of domestic students in STEM fields [16], U.S. graduate schools are increasingly counting on the influx of qualified international students [17]. Given favorable national policies towards STEM graduates, such as the aforementioned OPT extension, we predict that the number of international STEM students in the U.S. will likely continue to rise in the coming years. HEIs need to seize the opportunity emerging from this positive trend, and build a solid understanding of market trends and international student needs and behaviors for effective enrollment management.
A Market Perspective on International STEM Recruitment in the U.S.
The top three source countries of international students in STEM programs are China, India, and South Korea. However, based on overall enrollment, potential growth, and share of students in STEM fields, we believe the following markets are worth nurturing and cultivating.5 [18]
- India – Nearly seven out of 10 students from India enrolled in a STEM field in 2013. Although STEM is popular among Indian students at the undergraduate and graduate level, graduate enrollment is about 10 times larger than undergraduate, according to data from National Science Foundation (NSF).6 [19] Despite an eight percent drop in graduate enrollment from India in Fall 2012, we predict that there will be a rebound [20] in coming years, as CGS reports that first-time graduate enrollment from India in Fall 2013 jumped 40 percent from the previous year, while the number of Indians taking the GRE – the entrance examination used by most U.S. graduate-school programs – was up a massive 70 percent last year versus 2012.
- China – In contrast to India, China, the largest source country of international students in STEM fields, saw slower enrollment growth in Fall 2013. As compared to an average annual increase of over 20 percent in recent years, U.S. institutions experienced a relatively modest five percent growth of first-time Chinese graduate students in Fall 2013 (CGS). Graduate recruitment is important for this market as nearly two-thirds of Chinese graduate students were enrolled in STEM fields, as compared to less than one third of undergraduate students (NSF). How to propel the enrollment of graduate students is the near-term challenge for U.S. institutions within the Chinese market.
- Malaysia – Nearly 3,270 Malaysian students, or one out of two students from this country, studied in STEM fields in 2013, an 18 percent increase from 2010. NSF data indicates that roughly 80 percent of STEM students from Malaysia studied at the undergraduate level in 2010, making it a viable market for undergraduate recruitment.
- Nigeria – Nigerian students in STEM fields are on the rise. They grew by 21 percent in 2013 (nearly 3,260 students) from three years ago. One in two undergraduate students from Nigeria is enrolled in a STEM program, a share slightly higher than that at the graduate level (43%) in 2010 (NSF).
- Nepal – In 2010, 41 percent of students from Nepal enrolled in STEM fields, and this share grew to 52 percent three years later. Despite a decline of overall enrollment beginning in 2009, the number of Nepali students in STEM fields in 2013 almost paralleled the 2010 level. Hence, we still recommend Nepal as a market with high potential [21] for STEM student recruitment.
- Brazil – More than one out of five Brazilian students studied in a STEM field in 2013, an increase of 46 percent compared to 2010. As one of four major emerging markets [22], Brazil’s Scientific Mobility Program provides unprecedented opportunities for U.S. institutions to collaborate with the Brazilian government to enroll sponsored students.
- Saudi Arabia – Similar to the growth of Brazil, STEM students from Saudi Arabia grew by 143 percent from 2010 to 2013, representing one third of all students from this country. The King Abdullah Scholarship Program is extended to 2020 and will sustain opportunities and further fuel growth of Saudi Arabian students in the U.S [23].
- Iran – Despite the currency devaluation and increasing tensions between Iran and foreign countries [24], Iranians with sufficient financial means continue to study abroad. Total Iranian students in the U.S. almost doubled from 4,731 in 2010 to 8,744 in 2013. Three out of four students from Iran enrolled in STEM in 2013; one-half of the students enrolled in engineering programs alone. Tailing the U.S., India, and China, Iran ranks fourth for the most GRE test takers [25] in 2012, suggesting students’ continued interest in studying in the U.S. On one hand, escalating U.S.-Iran relations may damper Iranian enrollments, but Iran remains a solid market to recruit STEM students, particularly for U.S. institutions that can provide financial support to lessen Iranian students’ financial concern.
Understanding International STEM Students’ Information Needs and Behavior
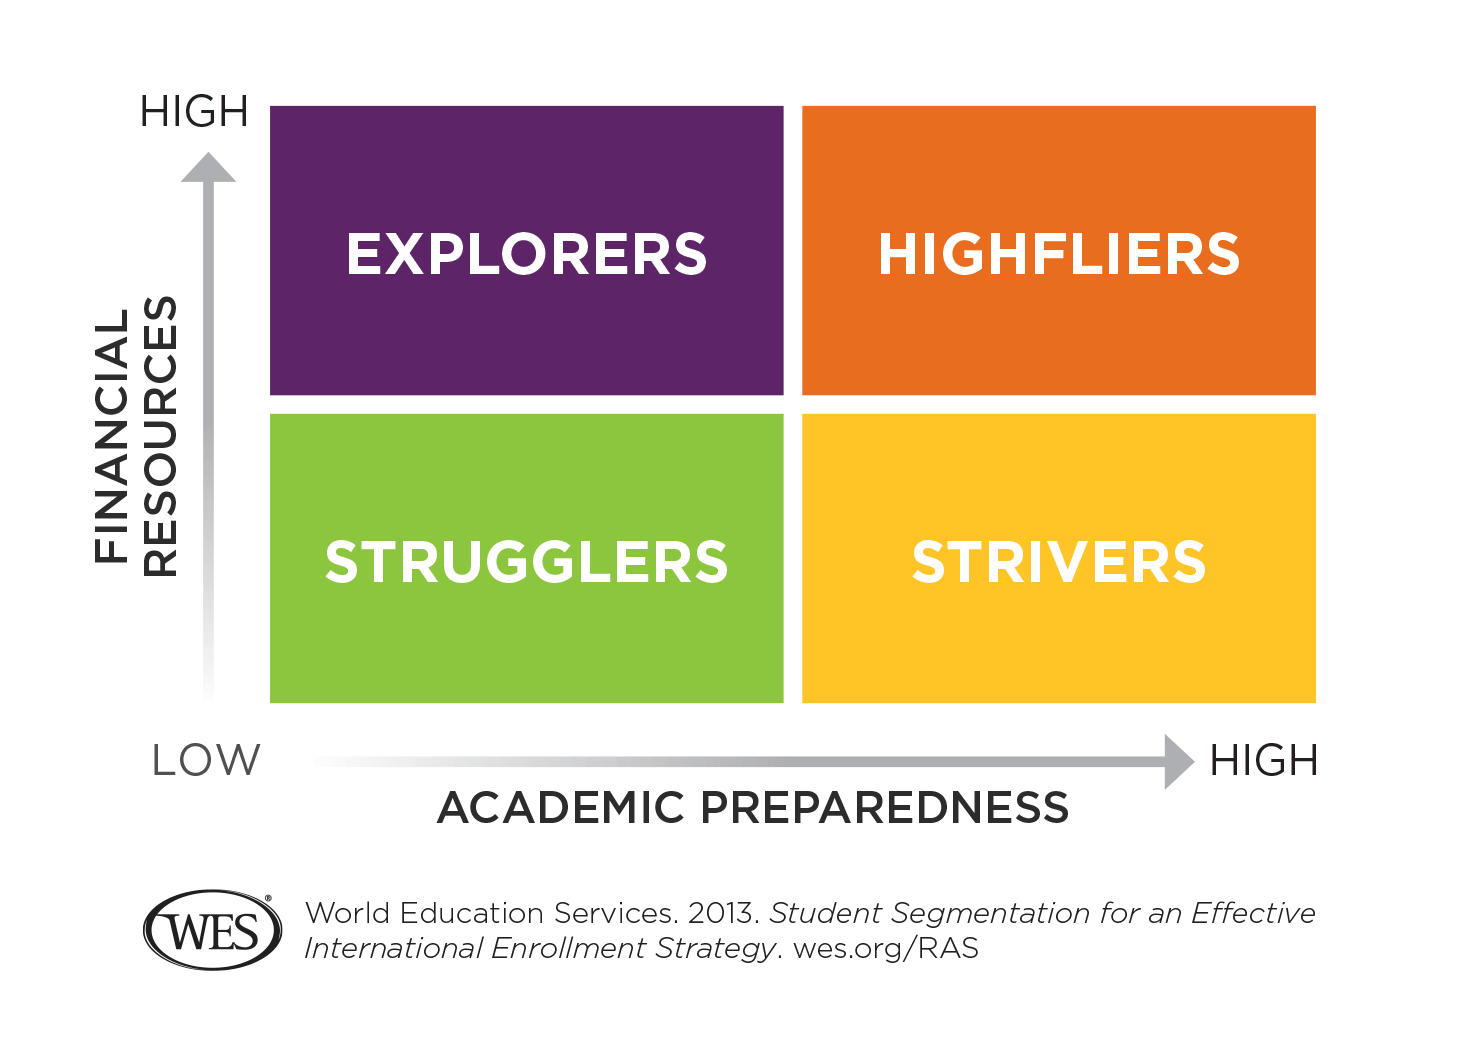
WES’ previous research [26] highlights that international students’ information needs and behavior differ by the four segments that we identify:
 [27]
[27]
EXPLORERS: Students with high financial resources and lower academic preparedness
HIGHFLIERS: Students with high financial resources and high academic preparedness
STRIVERS: Students with low financial resources and high academic preparedness
STRUGGLERS: Students with low financial resources and lower academic preparedness
We found that the share of Strivers (38% of 533 responses) in STEM programs is highest among all fields of study, averaging 31 percent of the total 2,992 responses.7 [28] Strivers are more academically prepared than their peers, but have greater need for financial aid. This segment is highly represented in students at the doctoral level and from source countries like India. In addition, the findings highlight the following characteristics of STEM respondents.
- Mirroring the overall response, STEM respondents utilized website (74%), web search (56%), and family and friends (53%) the most often in their university search. Two out of the three most important information channels are virtual-based, indicating the need to optimize online communication. Word-of-mouth continues to play a role in students’ information search journey, which suggests that peer and social recruitment will likely see positive returns too.
- STEM respondents sought information on program content (47%), career prospects (39%), and reputation (36%) the most often.
- STEM respondents (30%) chose financial aid as one of the top three information needs, as compared to 23% of overall respondents.
- Nearly one out of three STEM respondents (33%) chose faculty research as one of the top three information needs, 10 percentage points higher than the overall (23%).
- Experiential elements, cultural accommodation (5%), student services (11%), and location (15%), are the least sought after information needs of STEM respondents.
In line with international STEM students’ needs and behavior, a well-tailored communication strategy to meet institutional enrollment goals is strongly suggested. HEIs should ensure that information related to financial aid, faculty research, program strength, and career prospects is easy to find on websites and promotional materials. It is also recommended that institutions continue to explore virtual-based channels and strengthen word-of-mouth to promote academic programs.
Voices of STEM Respondents
“[Higher education institutions] can post videos introducing the requirement of applicants, publicize the general average level of enrollment, and also show us basic things we need to know after get[ting] admitted to the school. Also, giving students access to the faculty would be a great help for the students who want to know the professor better.” – A Striver
“The university can post details about fee structure, application deadlines, minimum requirements for that university like GRE, TOEFL, and IELTS, etc. Moreover they can also post the details of the scores who got admitted in their colleges and career opportunities after graduation so that false beliefs of the international students can be avoided to some extent.”– A Highflier
Conclusion
The global competition for STEM talent has created a dynamic environment for international STEM recruitment. While the UK and Australia are still recovering from the negative effects of tightened immigration policies, Canada has continued to develop immigration and employment policies designed to attract international STEM talent, and has seen strong enrollment growth as a result. Although the U.S. continues to enroll the most international STEM students of any country, the majority of students are enrolled at a limited number of HEIs, indicating that other colleges and universities may face challenges but also opportunities in successfully recruiting these students.
To sustain the appeal of the U.S. higher education system among international STEM students, U.S. HEIs need to understand student segments and develop effective enrollment strategies. In addition, they need to establish a balanced portfolio of markets from which to recruit, in particular among countries with attractive overseas government scholarships. Institutions also need to tailor their communication strategies to match students’ information needs and preferred channels of interaction by highlighting the strength of academic programs and potential career prospects after graduation.
1. [29] In this article, STEM statistics are defined by the following IIE fields of study, unless indicated: engineering; mathematics & computer science; and life & physical science. Institute of International Education. (2013). Open Doors Report on International Educational Exchange. http://www.iie.org/opendoors [30]
2. [31] Data are compiled from multiple government agencies about the enrollment in broad academic fields, and hence definitions may vary.
U.S.: IIE (See Note 1).
UK: Higher Education Statistics Agency (HESA). Data include engineering & technology; computer science; biological sciences; physical sciences; mathematical sciences. http://www.hesa.ac.uk/ [32].
Australia: Department of Education, Employment and Workplace Relations (DEEWR) Higher Education Statistics. Data include natural and physical sciences; information technology; engineering and related technologies. http://innovation.gov.au/HigherEducation [10]. Data refer to the academic year one year prior to the year shown. For example, 2013 refers to the 2011/12 academic year.
Canada: Statistics Canada (SC). Postsecondary Student Information System (PSIS). Data include physical and life sciences and technologies; mathematics; computer and information sciences; architecture, engineering and related technologies. http://www.statcan.gc.ca/ [33]. Data refer to the academic year one year prior to the year shown.
3. [34] National Science Foundation (NSF) and National Institutes of Health (NIH). Survey of Graduate Students and Postdoctorates in Science and Engineering (GSS). Data include number of full-time temporary resident enrolled by standardized broad academic disciplines in Fall 2011. We grouped engineering; physical sciences; geosciences; math and computer sciences; and life sciences as STEM fields. http://www.nsf.gov/statistics/gradpostdoc/ [35]
4. [36] Council of Graduate Schools (2013). 2013 CGS International Graduate Admissions Survey, Phase III: Final Offers of Admission and Enrollment. http://www.cgsnet.org/ckfinder/userfiles/files/Intl_III_2013_report_final.pdf [37]
5. [38] The majority of data are from IIE Open Doors (2013), CGS (2013) and NSF (2012) unless indicated. Note the definition of STEM is different between IIE and NSF data. We group IIE fields, Engineering, Math/ Computer Science, Physical/ Life Sciences, into STEM field, while NSF includes agricultural, biological, computer sciences, engineering, mathematics, physical sciences, psychology, and social sciences. Hence, NSF data may be larger than IIE. Additionally, IIE data are based on an annual institutional survey while NSF uses SEVIS data, which may contribute to the discrepancy between the two sources. See more at http://www.alliance-exchange.org/policy-monitor/07/13/2010/iie-analyzes-nsf-foreign-enrollment-study-context-open-doors [39]
6. [40] National Science Foundation (2012). Higher Education in Science and Engineering. In Science and Engineering Indicators 2012. Retrieved from http://www.nsf.gov/statistics/seind12/c2/c2h.htm#s4 [41]
7. [42] STEM fields in WES’ survey include engineering; math; computer science; and physical and life sciences. Of the 533 STEM respondents, 25 percent were pursuing bachelor’s degrees, 60 percent were pursuing master’s degrees, and 15 percent were pursuing doctoral degrees. Differences in respondent profile exist between academic levels, but the focus of this article is on the application of student segmentation by field of study.