By Alejandro Ortiz, Li Chang, Yuanyuan Fang, Research & Advisory Services, WES
International students contributed almost $27 billion dollars [1] to the U.S. economy in 2014, which corresponds to a 12 percent increase versus 2013 ($24 billion). The growth has been driven largely by students from upper-middle-income economies and countries with large national scholarship programs, which marks a significant shift from before the 2008 financial crisis.
By 2017, the global middle class is projected to increase its spending on educational products and services by nearly 50 percent, from $4.4 trillion in 2012 to $6.2 trillion [2]. Pull factors [3] in student-receiving countries such as higher quality of education, better living conditions and stronger labor market demand have driven the expansion of international student mobility since the 2008 financial crisis1 [4], and today growth in outbound student mobility from upper-middle-income countries such as China, Brazil, Mexico, and Turkey is outpacing growth from both low- and high-income countries.
Acknowledging the potential benefits international students can bring on board, we found that Canada, Australia and the U.K. are prompt in understanding the big-picture impact of international students. In the U.S. context, except for NAFSA’s annual economic impact report [5], voices on the benefits of international students to the national economy and institutional welfare are yet to be heard.
The purpose of this article is to reflect on the economic impact these new mobility trends and drivers are having on host countries at the national, local, and institutional levels. We first compare enrollments of international students in the top four English-speaking host countries (the U.S., UK, Australia, and Canada), before looking in more depth at the economic contribution of international students to the U.S. economy and select U.S. universities. We conclude with a look at the implications of the economics of student mobility for international enrollment management at U.S. institutions of higher education.
International enrollment growth being driven globally by students from low- and middle-income countries
An examination of economic trends related to international education reveals that since 2000, upper-middle-income economies – those with a gross national income (GNI) per capita between USD $4,126 to $12,745 [6] – are the ones driving growth in outbound student mobility. The total number of outbound international students from upper-middle-income economies jumped 161 percent between 2000 and 2012, as compared to only 29 percent from high-income OECD countries. Since 2006, the growth of students from high-income non-OECD countries such as Russia, Saudi Arabia, Singapore and the United Arab Emirates has largely been driven by government scholarship initiatives such as the King Abdullah Scholarship Program [7] and Brazil Scientific Mobility Program [8].
![WENR-0215-Feature_v2-1-600px[2]](http://wenr.wes.org/wp-content/uploads/2015/01/WENR-0215-Feature_v2-1-1200px2.png) [9]
[9]
According to the Institute of International Education (IIE), one third of all internationally mobile students [10] across the globe study either in the U.S. or the UK. Despite the negative impact of the 2008 financial crisis, the total enrollment of international students in the U.S. increased 42 percent between 2008 and 2014; however, enrollments have been declining in the UK since 2012 due mainly to the introduction of stringent visa policies. Meanwhile Australian enrollments have started to rebound after a significant decline beginning in 2010, and Canadian enrollments are continuing a steady decade-long upward trajectory.
A survey conducted by HSBC and Ipsos [11] MORI in 2014 found Canada to be the most affordable study destination among the big four English-speaking destination countries. At a cost of nearly US$30,000 a year, Canadian tuition fees and living costs averaged 29 percent less than in Australia, which was found to be the most expensive study destination.
![WENR-0215-Feature_v2-2-600px[1]](http://wenr.wes.org/wp-content/uploads/2015/01/WENR-0215-Feature_v2-2-1200px11.png) [12]
[12]
![WENR-0215-Feature_v2-table-1[1]](http://wenr.wes.org/wp-content/uploads/2015/01/WENR-0215-Feature_v2-table-111.png) [13]
[13]
Drivers of enrollment and the economic contribution of international students to the U.S.
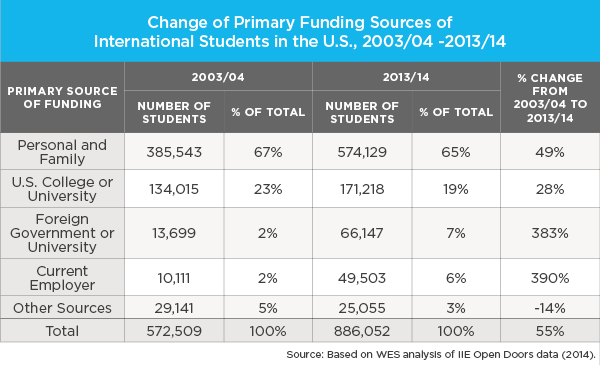
Based on WES analysis of IIE Open Doors data [14], the total number of international students in the U.S. increased 55 percent between 2003/04 and 2013/14. Self-financed students accounted for three-fifths (60 percent) of this growth, and today account for nearly two-thirds of all international students in the U.S. Over the same period, the number of international students receiving foreign government scholarships or foreign university funding almost quadrupled from 13,699 to 66,147; likewise, those funded by an employer jumped five times from 10,000 to 50,000. Meanwhile, the number of students sponsored by a U.S. college or university has declined to 19 percent, down from 23 percent in 2003/04.
The implications are clear: strong consumer demand and partnerships with foreign governments and foreign universities are currently the main drivers of international enrollment growth in the United States.
 [15]
[15]
An analysis from the Brookings Institute [16] shows that after the 2008 financial crisis the U.S. saw a sudden drop in enrollment growth from high-income OECD, lower-middle-income, and low-income countries. By contrast, there was continued growth from upper-middle-income economies fueled by strong consumer demand, and also from high-income non-OECD countries where students are more likely to be funded by the government.
According to the latest IIE Open Doors data, enrollments from China, India, and Saudi Arabia accounted for 81 percent of the 8 percent overall annual growth of international students in the U.S. between 2013 and 2014; however, the main sources of student funding from these countries varies significantly. According to WES’ segmentation study [17], students from China are most likely to have the financial means to afford a U.S. education. Saudi students also have high financial resources but they are more likely to be supported by government-funded scholarships, while Indian students are the most likely to rely on loans and institutional financial aid.
The boom of international students in the U.S. has been particularly notable in public HEIs, increasing 24 percent from 2007 to 2012. Overall, public institutions enroll 64 percent of all international students in the U.S.
![WENR-0215-Feature_v2-3-600px[1]](http://wenr.wes.org/wp-content/uploads/2015/01/WENR-0215-Feature_v2-3-1200px11.png) [18]
[18]
On average, states in the U.S. are spending 23 percent less [19] today per student on higher education than in 2008. The Pennsylvania State System of Higher Education, for example, has reduced its permanent workforce by 540 employees [20] and frozen or discontinued new enrollments in 198 programs. Arizona’s university system has cut more than 2,100 positions, and consolidated or eliminated 182 colleges, schools, programs, and departments. The University System of Georgia merged Southern Polytechnic State University and Kennesaw State University to reduce administrative costs [21].
In this context, international students have been a vital source of economic sustainability and growth for state and local economies throughout the recession. The University of Iowa reported [22] that international students spent $33 million on tuition alone, $67 million a year in the local economy, and more than $245 million to the state each year.
![WENR-0215-Feature_v2-4-600px[1]](http://wenr.wes.org/wp-content/uploads/2015/01/WENR-0215-Feature_v2-4-1200px2.png) [23]
[23]
Overall, the net contribution (total contribution from tuition, fees and living expenses minus U.S. support) of international students to the U.S. economy has been significant, growing 72 percent since the 2007/08 academic year, from $16 billion to $27 billion dollars. Direct contributions for tuition and fees alone nearly doubled during the same period, from $ 11 billion to almost $20 billion, while U.S. funding support only grew by 49percent over the same period from more than $6 billion to nearly $10 billion.2 [4]
The three U.S. states that attract the highest absolute number of international students – California, New York, and Texas – on average netted $31,000 per international student enrolled at an institution of higher education during the 2013/14 academic year. The total net income from international students in the state of California amounted to $4 billion, around $3.3 billion in New York and nearly $1.5 billion in Texas.
The table below shows the net contributions from international students at a few select public institutions in California, New York and Texas. For example, revenue from international students has increased by 146 percent at Stony Brook University since 2008, by 116 percent at the University of California, Los Angeles, and by 47 percent at the University of North Texas.
 [24]
[24]
Conclusions and recommendations
International students have become integral to the financial health of many U.S. higher education institutions, but the impact goes beyond money spent on tuition fees and living expenses. According to NAFSA, for example, for every seven international students enrolled, three U.S. jobs are created or supported [1], and in the 2013/14 academic year international students created or supported a total of 340,000 jobs nationwide.
International students are also helping to fill skills shortages at a time when the U.S. share of the world’s science and engineering graduates is declining [25]. A previous WES report [26] noted that international students are a vital source of enrollments for STEM (science, technology, engineering and mathematics) fields—in 2013 more than one in three international students in the U.S. was enrolled in a STEM field. International students also help promote a global learning environment. A recent study from Duke University shows that American students who actively interact with their international classmates are more likely to enhance their own self-confidence, leadership, and quantitative skills [27].
The road ahead for U.S. institutions of higher education will see increased competition from new education destinations like China [28]. The global share of international students in the U.S. has decreased [28] from nearly 23 percent in 2000 to 16 percent in 2012, despite large absolute gains. International students in U.S. institutions of higher education today account for just 4 percent of total U.S. tertiary enrollments [29]. As such, U.S. institutions have the capacity to enroll significantly more international students.
Expanding international student mobility to major source countries is driven by pent-up consumer demand in fast-growing economies and also by an increasing number of scholarship programs from international students’ home countries. HEI’s should continue to expand their recruitment efforts and improve their international student enrollment strategies by actively seeking partnerships with foreign governments, institutions and corporations, while also understanding the needs and behaviors of specific international student segments [30]. At the same time, HEIs need to be mindful of the gap between student expectations and their actual experience after they arrive on campus [31] and ensure that future enrollment strategies are sustainable. [32]
1. [33] Choudaha, R. & De Wit, H. (2014). Challenges and Opportunities for Global Student Mobility in the Future: a comparative and critical analysis. In Streitwieser, B. Editor, Internationalization of Higher Education and Global Mobility (pp19-33).Oxford, OX: Symposium Books Ltd.
2. [33] Percentage growth is calculated based on the raw numbers from source reports while we round up the amount of contribution to the nearest billion here.