Steve Literati, Deputy Executive Director, WES
NOTE: This article builds on ideas presented in an article that appeared in the February 2016 issue of World Education News and Reviews (“The Next Frontier: ROI Evaluation in International Student Recruitment”). It also builds on recent presentations from various conferences, including NAFSA, AIRC, and AIEA, whose authors put a great deal of effort towards advancing the state-of-the-art financial measurements of the impact of student recruitment in an international environment.
How should the university administrator in charge of international recruitment deploy scarce resources to get the “biggest bang for their buck”? Should she…
- …develop a source of students from relatively new, untapped countries?
- …reinforce efforts in countries that have provided reliable streams of students in the past?
- …attend more student fairs?
- …establish more agent relationships?
- …establish a partnership with a third-party pathway provider?
- …invest in social media recruitment efforts?
- …develop a stronger alumni network?
Each approach has specific costs, and each has variable potentials for returns. How can those variables be measured, compared and weighed against one another?
These are the questions senior international officers (SIOs), and international student recruitment and enrollment managers grapple with – especially when it’s time to prepare budgets, forecasts, and strategic plans. Too often, they lack the formal financial training that would ensure that they are able to tackle those tasks confidently.
The Ability to Discuss Stable, Objective Metrics = The Ability to Help Shape Strategic Planning Around International Enrollments
This article seeks to help address that gap. It provides SIOS and others with a practical framework for understanding and estimating relevant financial metrics. The cultural, intellectual, and academic benefits that a diverse international student body brings to campuses are indisputable. This article does not address those. Instead, it seeks to provide international admissions personnel who do not have financial backgrounds with a primer on the tools they need to speak to – and win over – senior administrators tasked with balancing universitywide budgets. It seeks to correct some misunderstandings about what ROI means to business managers versus those in the recruiting trenches, and focuses on financial metrics rather than operational metrics.
Why take this tack? Such financial metrics are critical to high-level university administrators, who have largely adopted them as decision-making and planning tools. In a lean financial environment, where competing priorities are the rule, these executives view financial metrics as objective, stable, and comparable across programs. Moreover, university executives, like their peers at for-profit corporations, often have their own performances judged by financial metrics than by operating metrics. Winning their support – and bringing a ‘best fit’ international student body to campus – means offering evidence that your initiatives are well-vetted, financially viable, and in support of the university’s broader strategic objectives.
To that end, this article defines and describes the three key financial metrics – return on investment, contributions, and per-student acquisition costs – that are most meaningful to senior-level administrators who set strategic direction and departmental budgets. It also corrects a disconnect between what operational, frontline enrollment teams often view as relevant ROI measures, and the much narrower and more precisely calculated ROI measures that senior executives want.
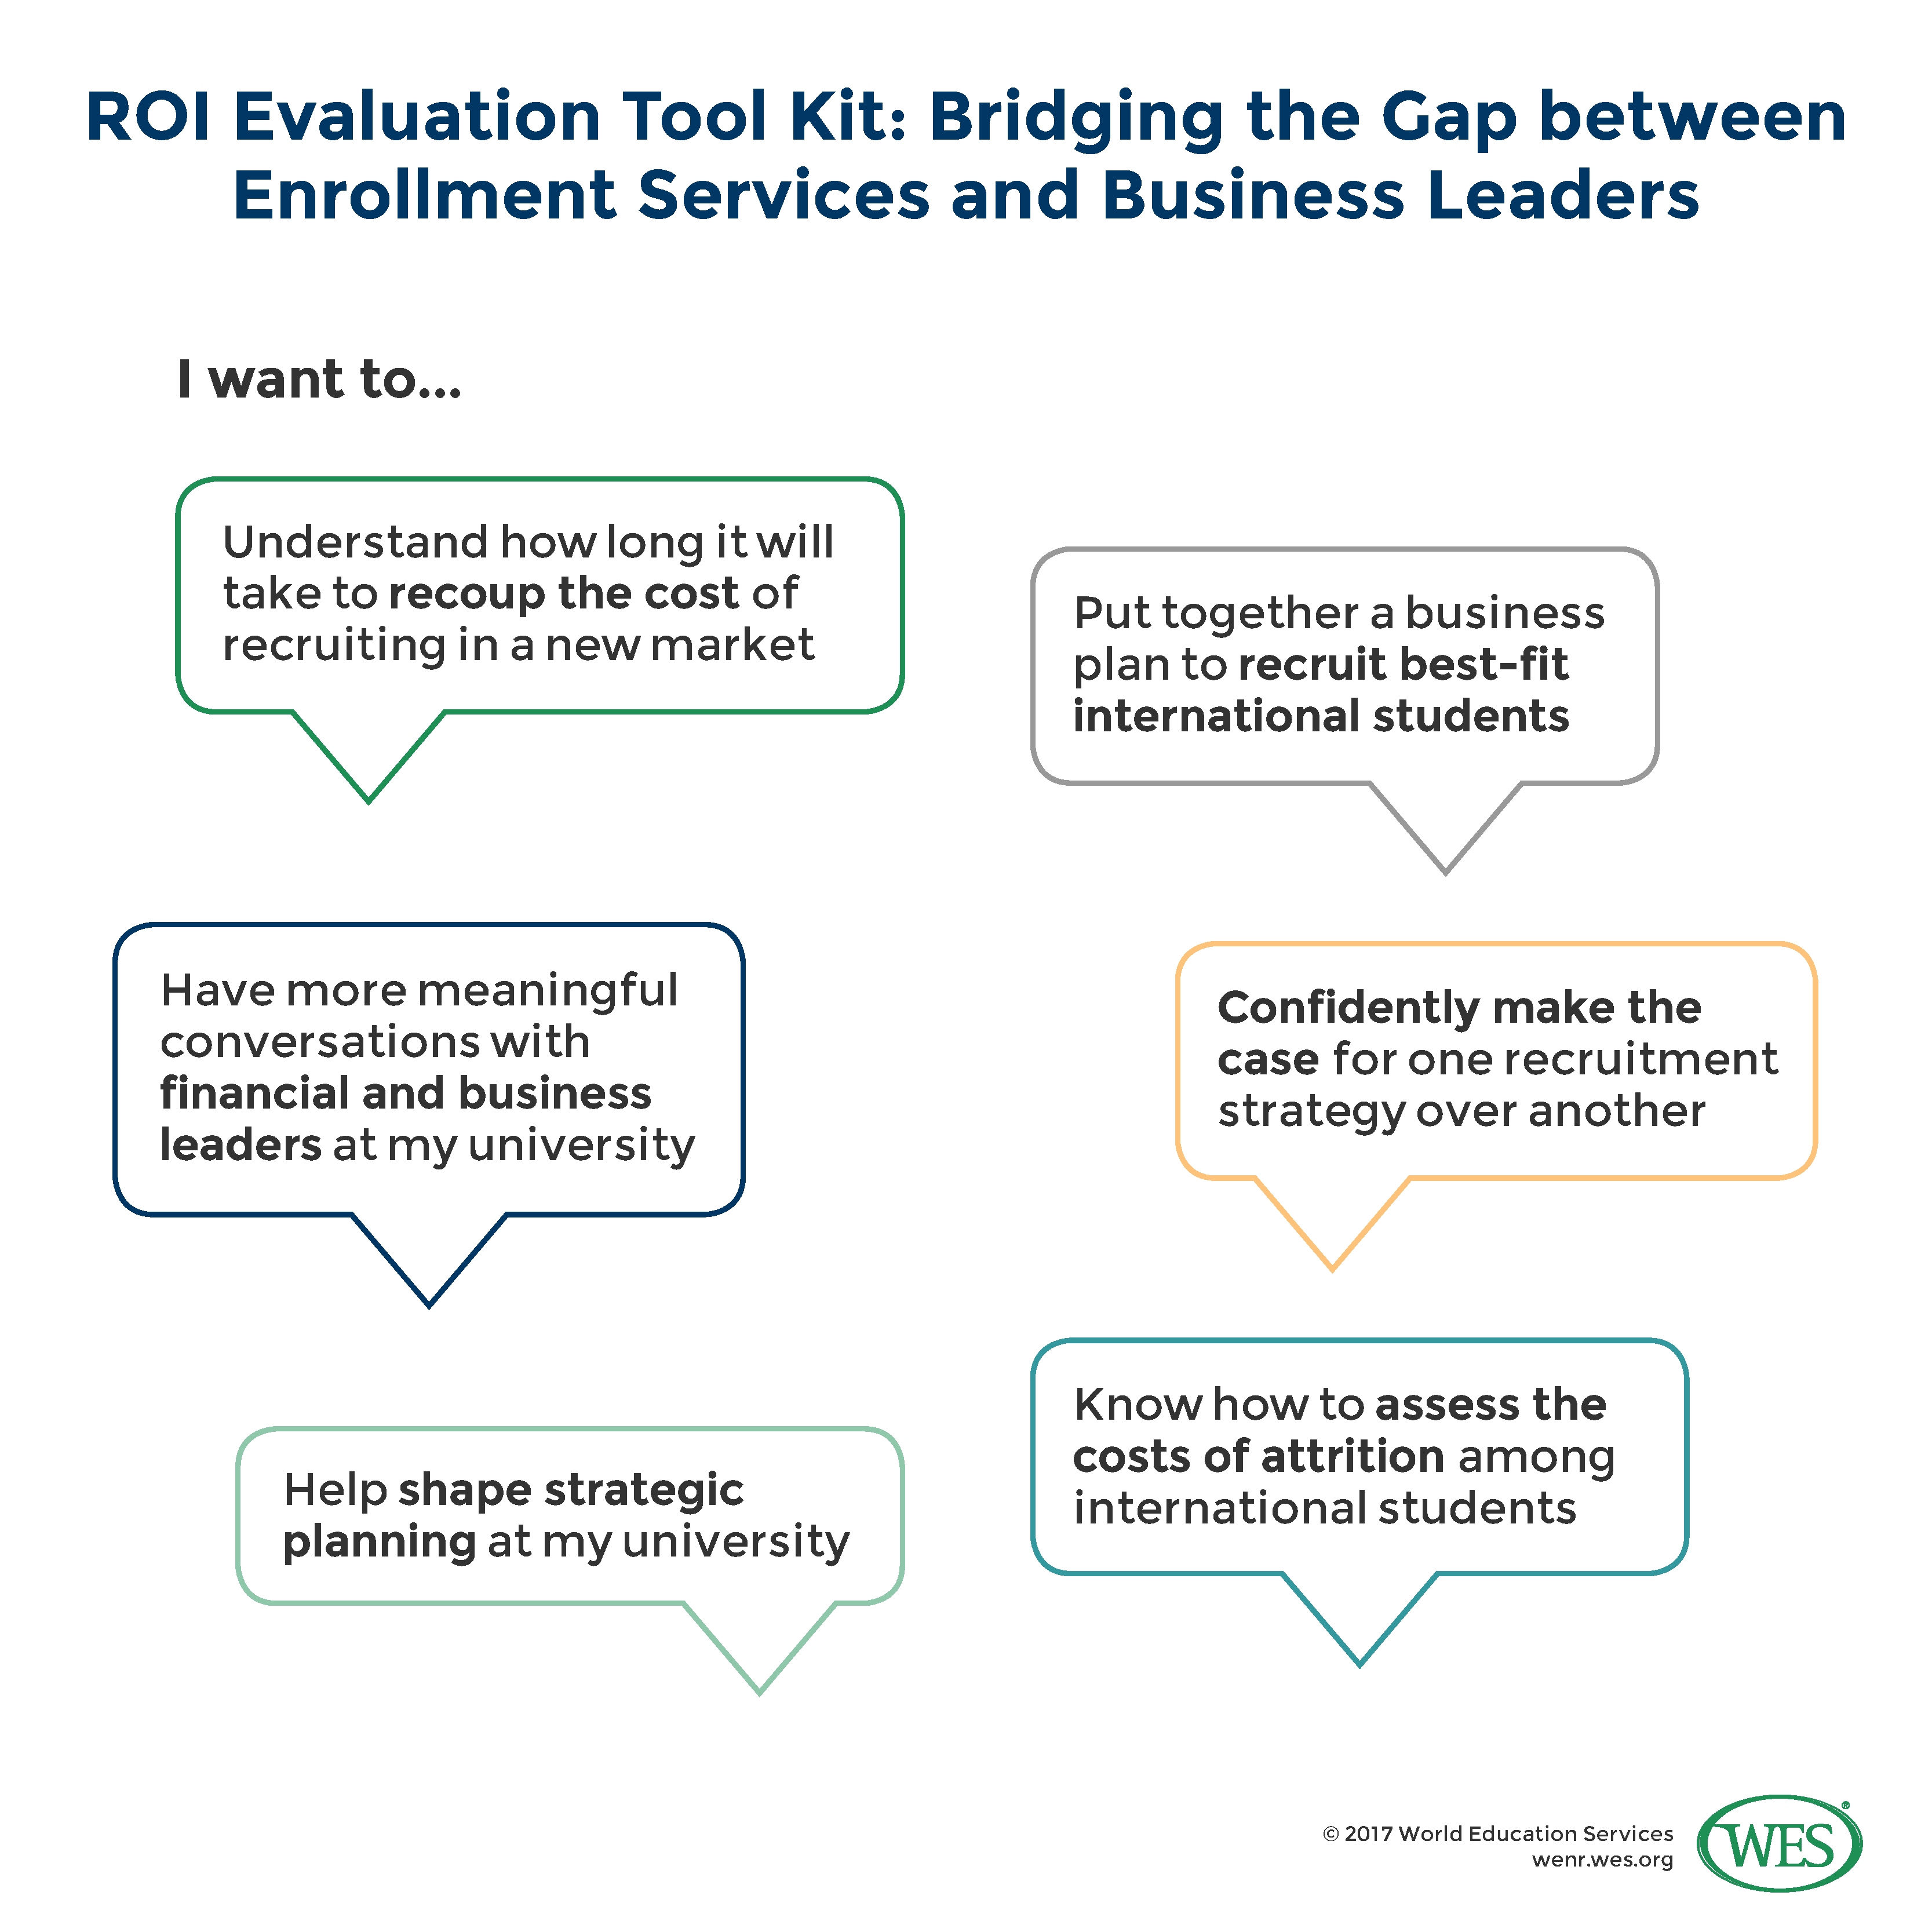
The goal is to provide SIOs and others with a powerful set of tools to:
- more confidently manage limited recruitment resources
- have more meaningful conversations with financial and business leaders of their universities
- contribute more fully to strategic planning processes at the institutional level
We’ll start with some fundamental concepts.
Laying the Ground Work: Basic Terms and Concepts
Making the case for one recruitment strategy over another – or one market over another – depends on familiarity with a handful of key financial concepts. Some are truly basic: scarcity and choice, for instance. Others, such as “hurdle rates,” are more complex.
Concept 1: Scarcity and Choice
Let’s say that at the end of the year you had an extra $1,000 that you managed to save. Although your choices of spending or investing are infinite, the amount you had at the end of the year to spend or to invest was limited or “scarce.”
Each choice you make about how to spend your $1,000 has implications for future scarcity:
- You could use that money to buy some new clothes, or take a trip. Spending in this way may provide emotional satisfaction, but after spending in this way, your money will be gone.
- You could use your money as a down-payment on a home.
- You could invest that money in the hope of generating a larger sum at some future date when sell your investment.
- You could deposit the funds in a bank savings account and earn interest.
- You could buy a stock that may either pay dividends and appreciate in value, or potentially lose value.
These same concepts of scarcity and choices hold true for universities. University executives may be faced with choosing to invest in building new luxury suites in the football stadium, hiring additional faculty, or devoting additional funds toward increasing international student enrollment. To meet the strategic goals of the institution, they must allocate scarce resources by carefully budgeting the amount and timing of cash outlays (whether spending or investment), and the amount and timing of the payback from investments.
Concepts 2 & 3: Risk and Return; Liquidity and Return
There is a positive correlation between the level of risk of an investment and the level of return demanded by investors. A savings account at a bank is generally considered safe, and not very risky. As a consequence, the interest paid by banks on savings accounts is generally low. Low risk will generally result in low returns, and vice versa. The level of risk associated with buying stock is considered riskier. Despite the strong performance of the U.S. stock market in recent years, stocks can either rise or fall in value. The Apple stock that you buy today at $136 per share may very well be worth less in a year’s time. Rational investors will demand a higher return for investing in Apple stock, which is built into the current price of a share of Apple stock.
Liquidity refers to the ease with which an investor can convert his or her investment into cash. A savings account is very liquid. You just go to the bank and withdraw your money to get cash. Shares of stock that are traded on exchanges (like Apple stock) are also relatively liquid. You tell your broker to sell the stock, and within a few days you will have cash (after you pay for brokerage commissions.) An investment in a house (or, in the case of a higher education institution, perhaps a stadium) is relatively illiquid. It may take weeks or even months to sell a house, and you will generally have to pay a sizeable commission to a real estate agent, and possibly fees to an attorney to complete a transaction.
There is an inverse relationship between liquidity and return. Investors who purchase illiquid investments (such as houses or equity in companies whose shares are not traded on exchanges) will demand higher returns than highly liquid investments.
Concept 4: Comparability of Returns
The study of finance is based on the assertion that all investments are comparable. Ranking investment options by their risk-adjusted returns, for instance, with projects that have the highest financial returns listed at the top and those with the lowest at the bottom, allows management to review investment choices.
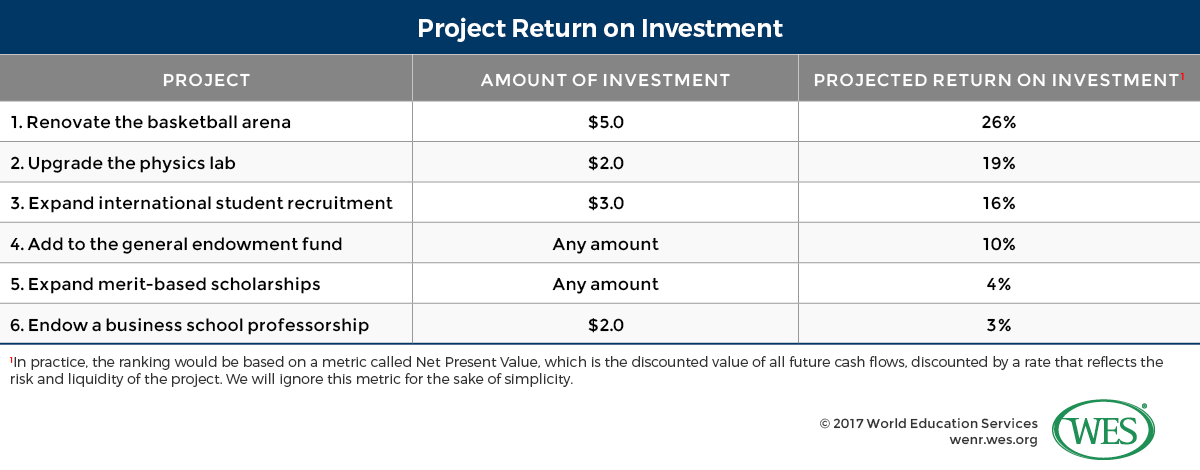
To illustrate, assume that a university that has $10 million to invest has the following choices of projects to invest in.
 [2]
[2]
Since the funds available to the university are scarce, the university would invest in the first three projects, which total $10 million. It would not invest in the last three projects because the expected returns of these projects are lower.
Concept 5: Hurdle Rates
In practice (and according to sound financial management), university management will establish “hurdle rates” for investments, and will pursue all projects that are projected to generate a return that is above the entity’s hurdle rate.
For a corporation, the hurdle rate should equal the return demanded by investors. For non-profit organizations, the rules about hurdle rates are a little more complicated.[1]We hope to explore this topic in greater detail in a future issue of World Education News and Review. Nevertheless, you may ask your university’s CFO or other financial official what the hurdle rate for the organization is seeking to achieve for its investments.
Concept 6: Accounting vs. Finance
Accounting rules are different than the finance principles that should guide your efforts to put together a set of meaningful metrics about various student recruitment initiatives.
- Accounting is usually defined as the “measurement, processing, and communication of financial information about economic entities.”[2]Wikipedia entry for “Accounting.” There are principles and pronouncements from various accounting industry authorities and government bodies that entities are required to use when preparing and reporting financial statements.
- Finance is based on the principles of economics rather than regulatory and industry-based rules. Finance uses a subset of accounting data to help investors (including business managers) make decisions about resource allocation.
Why is this distinction important? Because an accounting report is not the same as a financial analysis. In preparing an analysis of ROI and other financial metrics, you will use subsets of information from the accounting reports you receive. You will also include information that is not included in accounting reports – for instance, estimates of opportunity costs, which we’ll discuss below.
ROI Is Not Enough: The Three Key Financial Metrics You Need to Know
In articles that seek to provide advice to SIOs, recruitment officers, and enrollment managers, there is a high degree of imprecision in the use of the term “ROI.” Most include discussions of the following:
- Social media and digital marketing analytics, such as click-thru rates, page views, followers, and “likes”
- Yields, which measure the conversion of students as they move from inquiring about an institution, to applying for admission, to being offered admission, to finally enrolling at the institution
- “Soft” returns, such as brand awareness and student or administration engagement, which may benefit from certain investments and staff efforts
However, these are not measures of ROI, nor are they financial metrics. Rather, they are operating metrics and derivatives of financial metrics. They may be worth tracking, and helpful in decision-making, but they are not ROI, which most business professionals define rather narrowly.
High-level university administrators have largely adopted the tools (including financial metrics) employed by their counterparts in public, for-profit corporations. There are actually three financial metrics that should be considered most important in evaluating the performance of international student recruitment. They are:
- Return on Investment (ROI)
- Contribution (Dollars and Margin)
- Per Student Acquisition Cost
Let’s describe each of these as they are understood by most business executives, including those in university administration.
ROI
ROI falls into the category of financial metrics, which use accounting-based data to evaluate economic performance. At its most basic, it measures the profit or loss that results from an investing activity. For instance, if you purchased $100 of Apple stock on January 1st, and you sold that stock for $115 on December 31st, your profit on that investment would be $15 (before taxes). If you divided your profit of $15 by the amount you originally invested ($100), the ROI on your investment would be 15 percent. If you sold the Apple stock for $90 at the end of the year, your loss would be $10, and the ROI would be negative 10 percent.
Complications arise when we consider the income taxes that might be owed on the gain. Institutions and individuals all have different tax obligations. Additional complications arise if the time horizon of the investment is different than one year (ROI is usually expressed as an annualized number, and time periods other than one year must consider a concept called the time value of money. We will review ROI calculations in depth below, and will revisit the topic of time-value calculations there.)
Contribution, and Contribution Margin
Contribution is a measure of profit or loss from operations over some time period, for some entity or endeavor, such as a university or a division within a university (the business school, or the graduate division, or the office of international student enrollment.)
Contribution is fairly straightforward: It represents revenues less expenses. It is reported in an income or accounting statement.[3]Sometimes called the “statement of profit and loss” or “Statement of Operations.” Accounting statements, including income statements, follow strict rules set forth by the accounting profession and government regulators, although there is some leeway allowed for individual interpretation of these rules. (We’ll discuss this in greater detail later in the article.) A positive contribution is called income and a negative contribution denotes a loss.
| Contribution = Revenues – Expenses (C = R – X) |
For an organization responsible for international student recruitment, revenues would include tuition, room and board, and fees paid to the university by international students. Expenses might include the salaries and benefits paid to the people who work in the department, the cost of recruiting trips they take, the marketing programs, software and technology associated with their efforts, and perhaps an allocation for the building where they work.
Contribution margin is contribution (income or loss) divided by revenue, and is expressed as a percentage.
| Contribution Margin = Contribution/Revenue (CM = C/R) |
If an entity earned a profit of $25,000 on revenues of $200,000 its contribution margin would be $25,000/$200,000 or 12.5 percent.
Per-Student Acquisition Cost
Per student acquisition cost is calculated by dividing the total expenses associated with international student recruitment by the total number of international students that enroll in the university.
Per-student acquisition cost is a measure of efficiency, and a measure of how well the team responsible for international student recruitment is able to manage costs while delivering enrollment goals. Performing well in this metric is likely to result in good performances in the other two financial metrics that were discussed.
Financial Principles in Practice: Determining ROI
The financial returns of any discrete international student recruiting activity, endeavor, or investment can be estimated. You can calculate the predicted ROI of:
- Student recruitment in established sourced countries such as China or India
- Student recruitment in a new country or geographic region
- Employing agents to recruit students
- Engaging in a partnership with a third-party pathway provider
- Undergraduate recruitment vs. graduate student recruitment
- Instituting a social media campaign
- Purchasing lists of students who took English language proficiency or college entrance exams
The ROI of each initiative can then be compared to the others. It can also be compared to any alternative investment opportunity available to the university (e.g., renovating the basketball arena.)
Sound “apples-to-apples” comparisons depend on having a clear framework for which variables to include and what to leave out.
Keep five key principles in mid as you work.
Principle 1: Include “incremental” expenses only
Accounting departments typically report expenses on a monthly basis in a report called a budget or expense report. The report shows revenues and expenses.
You will begin your ROI calculation by reviewing the expense report for your department. Some of the expenses tracked in that report may not be directly relevant to international recruitment.
When calculating financial metrics, only incremental expenses should be included. In the context of evaluating the ROI of international student recruitment, this means including only those expenses that are incurred directly in the activities associated with the effort you are attempting to measure.
Exclude items not directly related, for instance, such as executive compensation, costs of technology infrastructure, and occupancy charges. If your university suddenly stopped recruiting international students, would the compensation of the university’s executive management go away? Probably not. So if your budget includes an allocation representing administrative compensation, it should be excluded when estimating ROI.
On the other hand, if international student recruitment was stopped, certain individuals within your department (including you) might lose their jobs (or be transferred to another function within the university). Similarly, the costs of overseas recruiting trips would cease. These costs should be included in an ROI calculation.
The easiest way to evaluate whether an expense is directly related is to ask a simple question: “If we did not recruit international students, would this expense have been incurred?”
Principle 2: Include opportunity costs
Opportunity costs are incurred when you choose to discontinue one course of action in order to pursue another. For instance, you would incur an opportunity cost when you opt to enroll domestic students in seats that you originally allocated to international students. The opportunity cost is easily calculable.
Let’s illustrate this with an example.
Assume that international students at University A pay fees and tuition of $40,000. Domestic students pay $25,000 in fees and tuition.
The opportunity cost of replacing an international enrollment with a domestic enrollment is thus $25,000.
| Tuition & fee revenue from international student | $40,000 |
| Tuition & fee revenue from in-state student (Opportunity Cost) | 25,000 |
| Net contribution from enrollment of international student | $15,000 |
Why does this need to be in your ROI analysis? It helps you build a case about the risks of failure to invest in recruitment efforts.
Imagine your university had capacity for 8,000 freshman and targeted 2,000 of these to be international students. Failure to fund recruitment efforts could lead to persistent shortfalls in international student enrollments. The seats would likely go to domestic students. In each case, the opportunity cost – and the impact on revenue – is easily calculable.
Opportunity costs do not appear the reports provided by your accounting department. However they can be calculated, and should be included as expenses in your analysis.
Principle 3: Include relevant costs incurred by other departments
On a slightly different topic, let’s assume that some expenses associated with international student recruitment fall outside of your department budget. Let’s assume that all international travel is captured in another department’s budget. Should you exclude this expense from an ROI analysis?
Of course not! If the expense is associated with international student recruitment and you are trying to quantify that investment return, the expense should be included no matter where it is recorded. Common sense would prohibit doing otherwise.
Principle 4: Ignore sunk costs
A sunk cost is one that has already been incurred and cannot be recovered. In rational economic decision-making, these costs should be ignored.
Let’s say you invested in an applicant tracking system last year. You decide that you want to estimate the projected ROI for a new social media campaign aimed at Indian students. You should not include the cost of the applicant tracking system because it cannot be recovered and bears no relation to whether or not you decide to invest in the Indian social media campaign.
Principle 5: Measure the entire economic cycle, and consider the time-value of money
Many investments require expenditures that occur over several years, with returns that may also occur over the span of several years. As an example, let’s say that you decide to engage in an effort to recruit students from Vietnam, a country not currently represented at your university.
Before you see enrollment yields that make the investment worthwhile, you must plan:
- Several years of recruiting trips
- Participation in student fairs
- Advertising
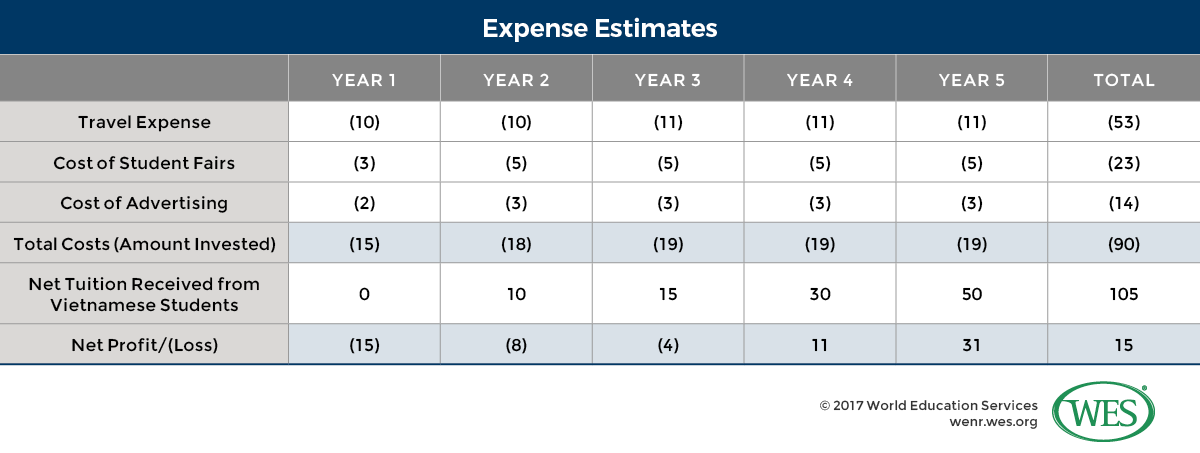
You should estimate the expenses (shown as negatives) and the revenues of this effort in the table below (in $ thousands):
 [3]
[3]
Note that this investment becomes profitable in the fourth year. What is the ROI of this endeavor?
If you ignore the timing of the returns, you might say that the return on investment is:
| Total Net Profit Total Amount Invested |
= | 15 90 |
= | 16.7% |
However, if you consider a ROI metric that considers the timing of the returns (the time value of money) called the Internal Rate of Return (IRR), the return is 15.0 percent.[4]The calculation of IRR is beyond the scope of this article. Ambitious readers can either Google the subject or use the IRR function in the Microsoft Excel software application.
Unless you are familiar with the concepts of discounting and compounding, or the calculation of metrics such as Internal Rate of Return (IRR) and Net Present Value (NPV), you should request someone from the university’s finance staff to help you.[5]Both IRR and NPV are functions in the Excel spreadsheet application.
What’s Next?
The next step in this process is actually calculating the three financial metrics (ROI, Contribution, and Per Student Acquisition Costs) discussed here. In the fall, as planning season heats up, I’ll publish a second article on this topic. In it, I’ll provide an example with a set of assumptions, and show how each metric is calculated. The goal is to walk you through the process of measuring these three key metrics, as though you were the SIO for University A. Until then, begin working with some of these concepts. Estimate the opportunity costs of missing your target enrollment of out-of-state students by 10 percent. Assess what costs from other departments should be included in your calculations. Obtain a budget or expense report from your accounting department, and determine which costs should be counted as incremental in terms of your recruiting efforts.
Remember: The goal of this work is building the rich, diverse, international student body that you want on campus. The first step toward that is building the business case that your senior leadership needs to hear to invest in your plans. Happy gathering, and have a wonderful summer. We’ll add further scaffolding to these ideas with a new article to be published in the fall.
References
| ↑1 | We hope to explore this topic in greater detail in a future issue of World Education News and Review. |
|---|---|
| ↑2 | Wikipedia entry for “Accounting.” |
| ↑3 | Sometimes called the “statement of profit and loss” or “Statement of Operations.” Accounting statements, including income statements, follow strict rules set forth by the accounting profession and government regulators, although there is some leeway allowed for individual interpretation of these rules. (We’ll discuss this in greater detail later in the article.) |
| ↑4 | The calculation of IRR is beyond the scope of this article. Ambitious readers can either Google the subject or use the IRR function in the Microsoft Excel software application. |
| ↑5 | Both IRR and NPV are functions in the Excel spreadsheet application. |