Makala Skinner, Research Associate, WES
Twenty years ago, the Sorbonne Declaration kicked off what would become known as the Bologna Process, a massive intergovernmental effort to coordinate international higher education within Europe. Its purpose was to create a framework for harmonizing degrees and credits throughout Europe to overcome the barrier to education posed by differences among national educational systems. One year after the Sorbonne Declaration, higher education ministers from 29 countries came together to address this barrier and formed the European Higher Education Area [1] (EHEA). Now comprising 48 countries [2], the EHEA today is a voluntary, regional project which seeks to establish comparable, high-quality higher education systems.
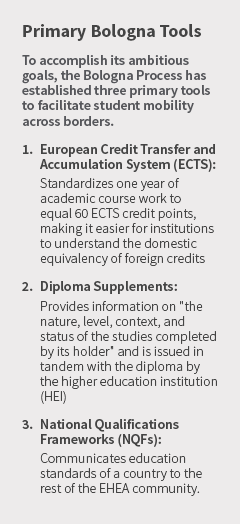 [3]One year after the Sorbonne Declaration, the Bologna Declaration was signed into existence, and the two together provided the foundation from which the Bologna Process would develop. Since 1999, the Bologna Process has evolved through eight communiqués [4]—documents articulating reforms and commitments made by the member countries during Ministerial Conferences. The communiqués take place every few years and have expanded the scope of the EHEA. The priorities first outlined in the Sorbonne Declaration include mobility of students and teachers, a common two-cycle degree system, the use of credits, and the establishing of Europe as a knowledge region. Since that time, quality assurance, social dimension, and lifelong learning, along with European cooperation in these areas, have all been added as key priorities.
The Bologna Process includes tertiary education standards at the bachelor’s, master’s, and doctoral levels; credential recognition; and a commitment to educational quality. Combined, these three commitments work toward increasing student mobility and internationalization.
Measuring the effectiveness of the overall goals of the EHEA, however, has proved difficult. The 2015 Bologna Process Implementation Report concluded [5] that “… it was not yet possible to estimate whether the EHEA collective target of 20 percent mobility by 2020 could be reached or not, as comprehensive and harmonized data collection are not yet fully in place.”
Available data do show that the Bologna Process has spurred substantial growth in international student movement within the EHEA over the past two decades, but this trend has been felt unevenly across countries. Some nations have experienced, and continue to experience, tremendous growth in inbound EHEA students, while other countries show only modest growth, particularly in recent years. To see how the Bologna Process has influenced international student mobility for EHEA countries, WES explored 20 years of inter-EHEA student mobility trends and presents the findings below.
EHEA Mobility Trends
Since the Bologna Declaration, mobility between EHEA countries has substantially increased overall. WES examined EHEA student mobility trends of 26 countries that meet two criteria: (1) the country joined the EHEA in 1999; and (2) it had longitudinal data available. Through this exploration, we found that trends over time have varied considerably based on country.
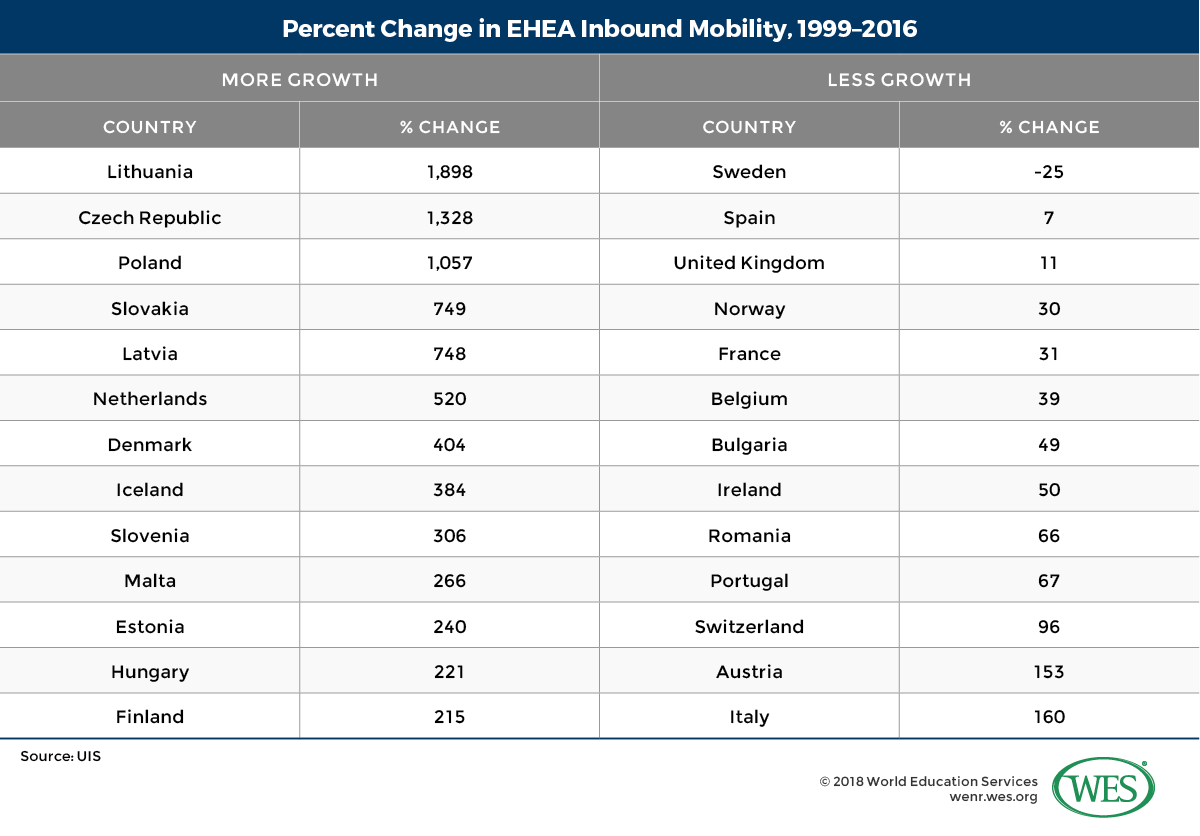
For example, between 1999 and 2016 Lithuania, the Czech Republic, and Poland all experienced more than a 1,000 percent increase in inbound EHEA students, while Sweden experienced a 25 percent decrease in this same period (see Table 1).
 [6]
[6]Table 1
These percentages are to be taken with a grain of salt, however, as some countries were already primary study destinations prior to the creation of the EHEA, such as the United Kingdom, and have substantially higher student volumes. So though Lithuania saw a 1,898 percent increase, this equates to only 2,619 students, compared with the U.K.’s 11 percent increase, which accounts for 13,471 new students.
Recognizing that some EHEA countries traditionally send more EHEA students and other countries traditionally receive more, the EHEA included “mobility balance [7]” as a focus during the 2012 Bucharest Communiqué. Mobility balance tracks the ratio of incoming and outgoing higher education students between EHEA countries with the goal that countries send and receive similar numbers of students. This tracking is meant to acknowledge that unbalanced mobility may create knowledge flows out of one EHEA country and into another, to the detriment of the sending country.
 [8]
[8]Figure 1
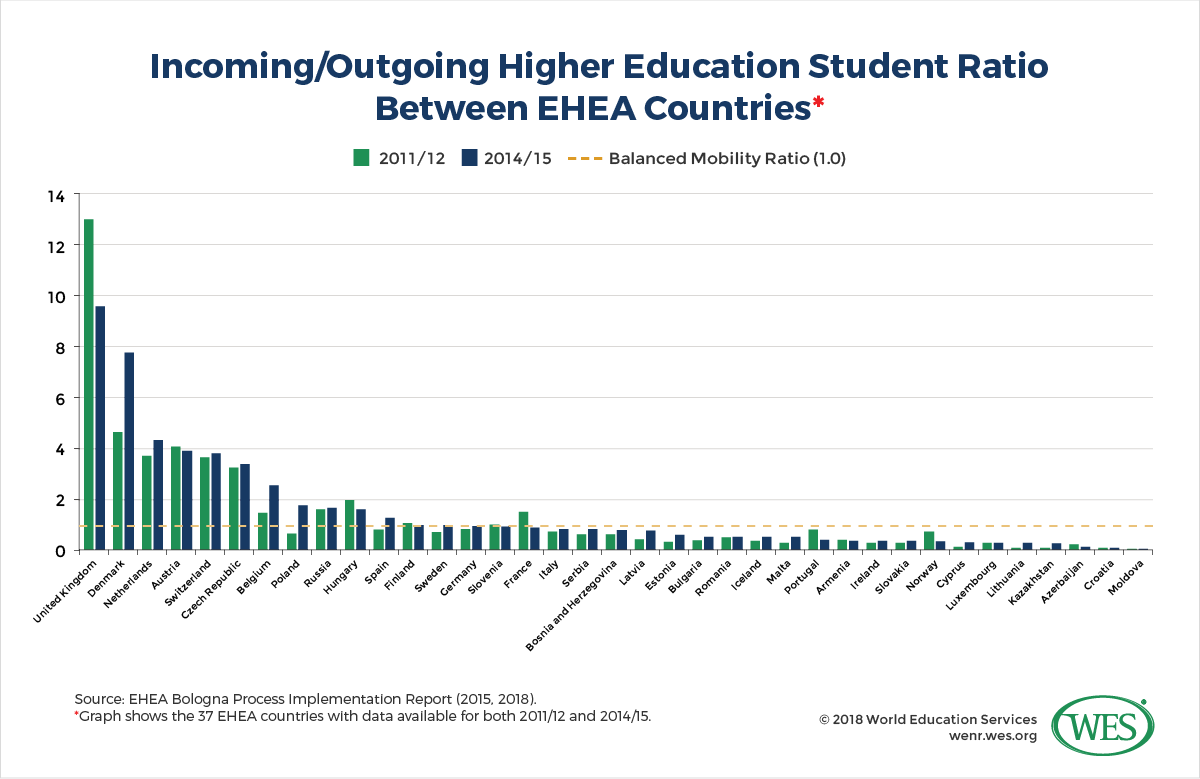
Figure 1 shows incoming/outgoing higher education student ratios between EHEA countries, with ratios higher than 1.0 indicating a greater proportion of inbound students and ratios lower than 1.0 indicating a greater proportion of outbound students. According to The European Higher Education Area in 2018: Bologna Process Implementation Report [7], and its predecessor published in 2015 [9], the majority of EHEA countries export more students than they import. In 2014/15, 11 countries were importer countries, compared with 26 exporter countries.1 [10] The U.K., Denmark, and the Netherlands had the greatest proportion of incoming EHEA students, while Moldova, Croatia, and Azerbaijan had the greatest proportion of outgoing EHEA students.
Interestingly, between 2011/12 and 2014/15, many countries saw only negligible shifts in their mobility ratio; the U.K. and Denmark were notable exceptions. The U.K. saw a 26 percent drop in its mobility balance from the previous data year, dropping to a ratio of 9.45. Even with this drop the U.K. still has the most imbalanced mobility ratio of all EHEA countries, and “report[s] nine times more incoming mobile students than outgoing ones [7]” (EHEA Bologna Process Implementation Report, 2018, p. 260). Denmark, on the other hand, saw an increase of 3.09 in its mobility ratio, jumping from 4.56 to 7.65, resulting in greater mobility imbalance.
 [11]
[11]Figure 2
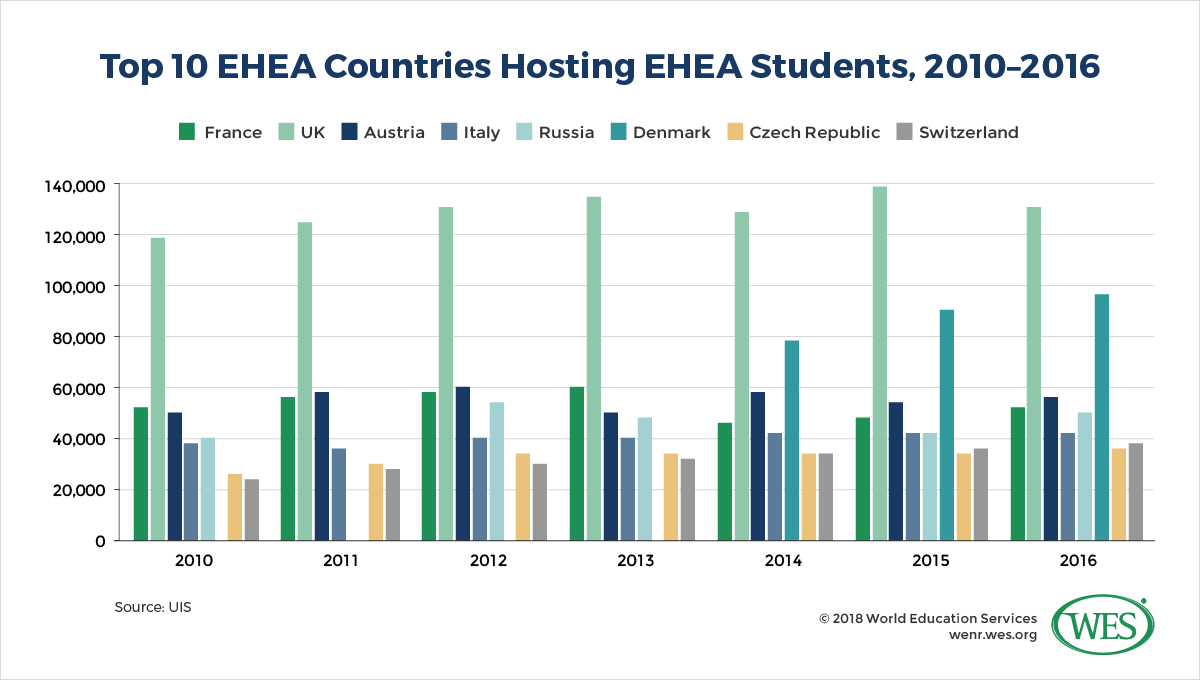
In terms of numbers, the U.K. and Germany far and away receive the greatest number of EHEA students, hosting 129,129 and 95,275 students respectively in 2016. Many of the other top 10 importer countries for EHEA students, however, have had relatively flat student numbers since 2010, experiencing only negligible growth or even decline (see Figure 2). France hosted 1,284 fewer EHEA students in 2016 than it did at the start of the decade, and the U.K. and Austria experienced only 10 percent and 14 percent growth.
Conversely, Poland more than doubled its number of incoming students from 2013 to 2016 alone; and the Netherlands brought in an additional 30,011 inbound EHEA students in 2016, compared with its 2010 numbers. These two EHEA countries stand out, both in terms of percentage growth, and in terms of their sheer numbers of inbound EHEA students. As the top host country for EHEA students, the U.K. is an important player in Bologna as well, yet its growth has been comparatively low, and has begun to fall in recent years. All three countries demand a closer look.
Poland
Poland’s success can partially be attributed to an ambitious internationalization strategy [12] developed in 2015 by the Polish Ministry of Science. The strategy aims at more than doubling the number of international students in the country by 2020. To support initiatives such as language training and international education programs, the government has put 57.5 million euros toward the plan. Since that time Polish HEIs have increasingly offered more courses with English as the language of instruction—by one estimate [13] even going so far as to double the number of these courses since 2015. In addition, Study.EU’s Country Rankings for International Students [14] ranked Poland in the top 10 for the first time this year, an indication of the gains Poland has made in becoming an attractive study destination.
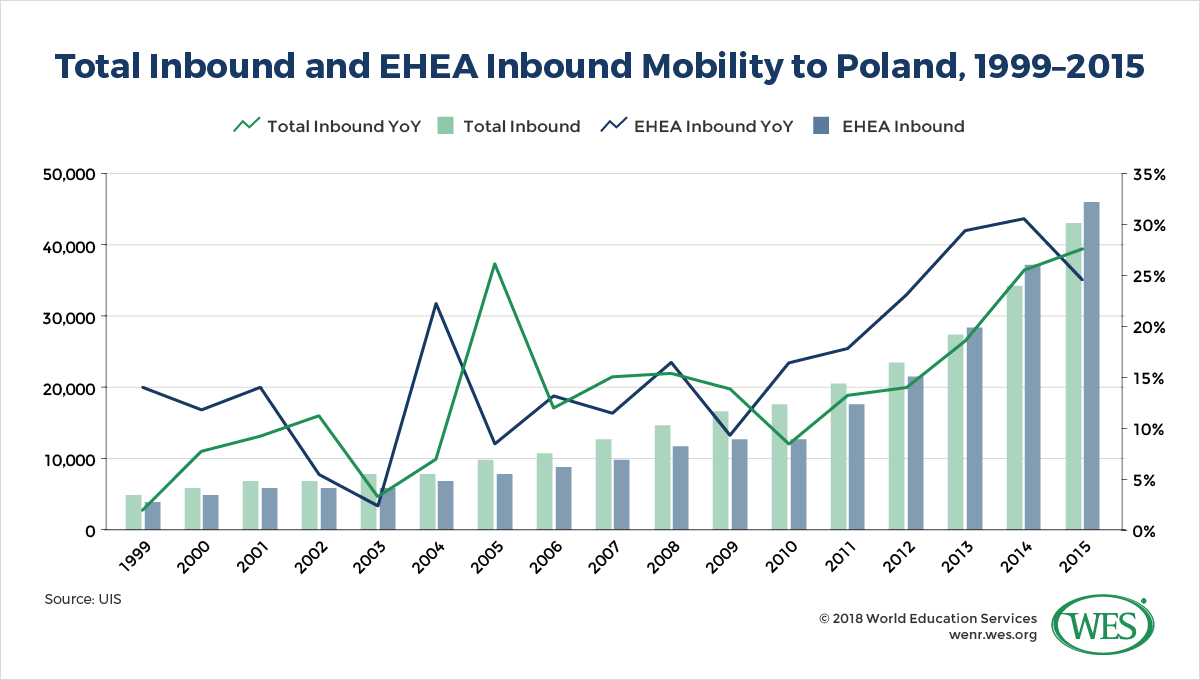
Since the inception of the Bologna Process, Poland has increased its inbound EHEA student population by 1,057 percent, totaling 42,637 students (see Figure 3)—three times more than the U.K.’s student number increase, despite hosting approximately 26 times fewer students at the starting point in 1999. Poland has seen significant growth in both its total inbound international population as well as EHEA-specific students. Between 2010 and 2014, the year-over-year growth of inbound EHEA students was significantly higher than the total inbound student year-over-year growth, indicating that Poland is experiencing particular success in recruiting EHEA students.
 [15]
[15]Figure 3
The Netherlands
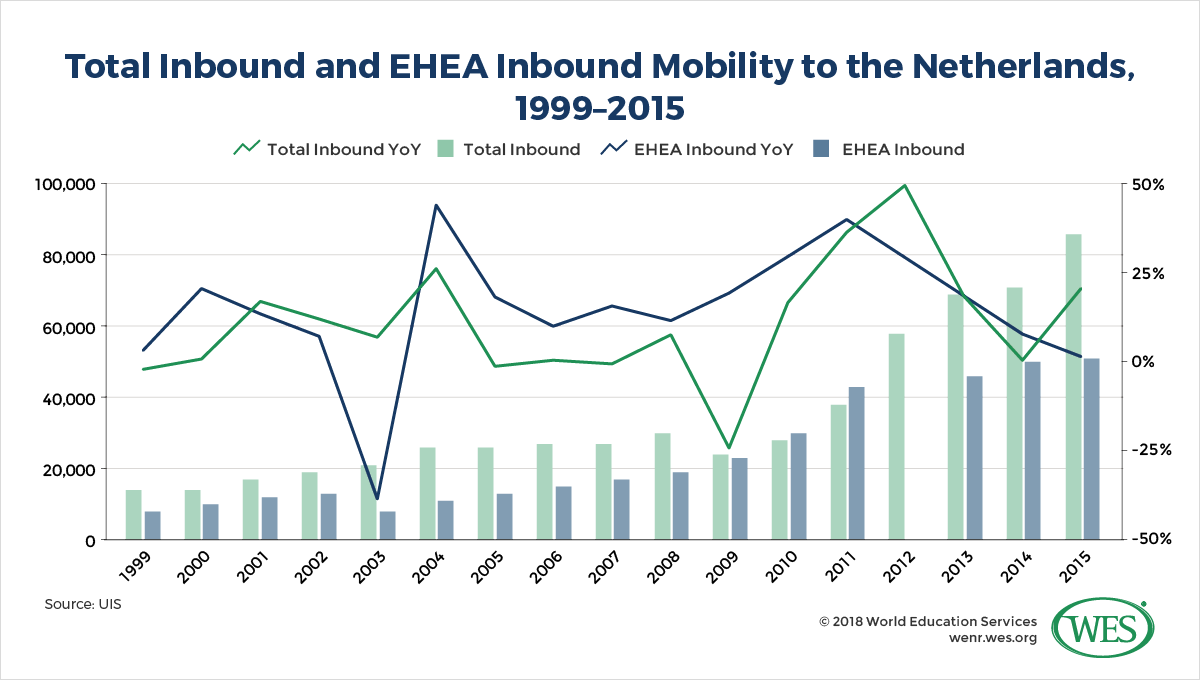
Not far behind Poland is the Netherlands, which saw a total student increase of 42,505 inbound EHEA students between 1999 and 2016 (see Figure 4). Since the Netherlands began with more students than Poland did, this is “only” a 520 percent increase, compared with Poland’s 1,057 percent increase. From 2004 to 2011 EHEA-inbound, year-over-year growth outstripped total inbound growth. Interestingly, this pattern has reversed itself in the past few years: 2015 saw a 22 percent year-over-year growth rate in total inbound international students, compared with only a 2 percent year-over-year increase for inbound EHEA students. The reversal may indicate that the Netherlands is becoming a more attractive education destination for non-EHEA countries than for EHEA countries.
The Netherlands has seen significant increases in inbound international students for many reasons, including comparatively low tuition, high rankings—it ranked as the fourth most attractive European country [14] for international students this year—and multiple courses taught in English [16]. In addition, the Nuffic Netherlands Education Support Offices [17] (NESO), which advertise and brand Dutch higher education in 11 countries, have been successful in strategically driving growth. Nine of the NESO countries are located in non-EHEA countries, while only two NESO offices—in Russia and Turkey—are located within the EHEA.
 [18]
[18]Figure 4
The U.K.
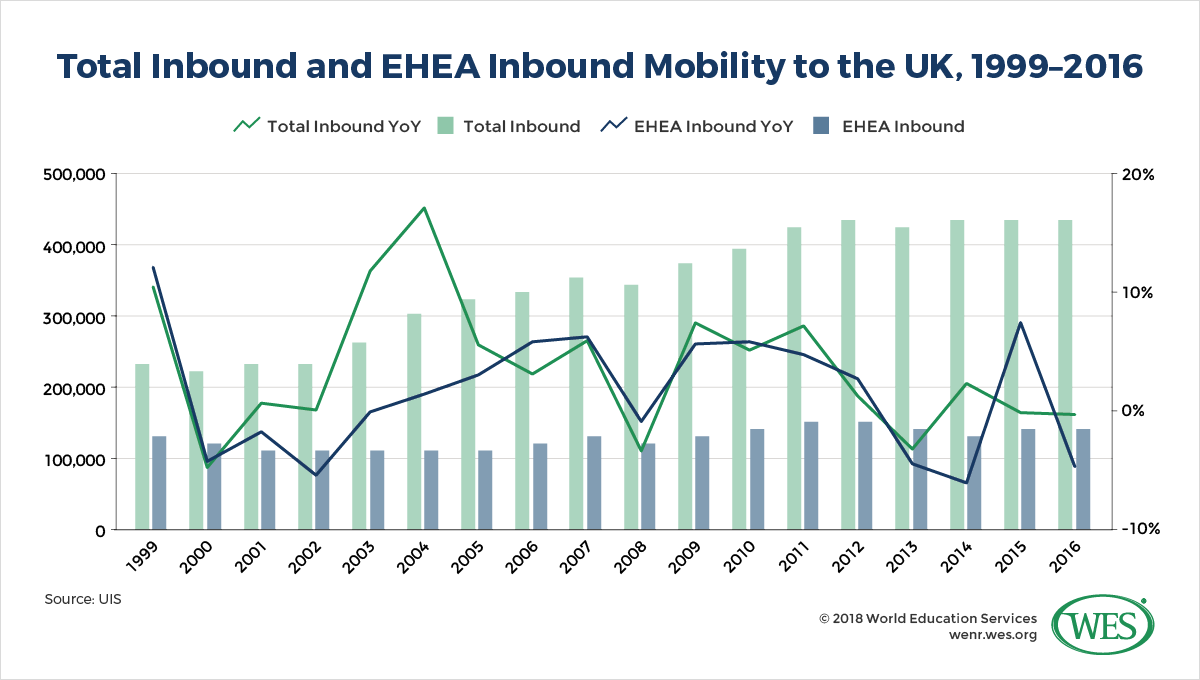
While Poland and the Netherlands are experiencing pronounced growth, the U.K. has seen only a minimal increase in inbound EHEA students for the past several years (see Figure 5). Following a period of year-over-year decline from 2010 to 2014, EHEA enrollment rose by 8 percent in 2015 in the U.K. Notably, total inbound student growth has largely outstripped inbound EHEA growth since the Bologna Process began, most likely because the U.K. is a top education destination worldwide.
Its global popularity notwithstanding, in 2016 the U.K. saw a 5 percent drop in year-over-year EHEA inbound mobility compared with a zero percent overall change in total inbound mobility. This drop likely reflects a response to Brexit, the U.K.’s decision to leave the European Union (EU). Though the EHEA excludes two European countries and includes six non-European countries, it has significant overlap with the EU. Brexit will therefore have ramifications for many EHEA students studying in the U.K.
EU students in the U.K. currently receive the same benefits as domestic students, but after the country withdraws its membership, the EU student status may change [19]. In July, the U.K. announced [20] that EU students pursuing their education in England will still pay the same tuition fees as domestic students for the first enrollment following Brexit. This is good news for student mobility in the short term, but the U.K. has not decided how EU students will be categorized thereafter. If the government switches EU students to international student status, it would result in higher tuition fees [19] and ineligibility for U.K. student loans, likely curtailing EU (and consequently, much EHEA) student mobility into the U.K.
 [21]
[21]Figure 5
Looking Ahead
Since 1999, the implementation [22] of Bologna Process objectives has come a long way. The majority of EHEA countries have adjusted their higher education systems to reflect the required three-cycle degree structure, and adopted the primary Bologna tools (ECTS, Diploma Supplement, NQF). Bologna continues to evolve and adapt with the times, revising its processes and adopting new measures through the regularly held communiqués. Over time, the Bologna Process has been influential in driving international student mobility, and continues to influence world regions [23] today.
The variation in growth among the countries—with some experiencing rapidly increasing influxes of students while others see only minimal growth or even stagnation—likely reflects differences on the national level, such as the political and economic landscape, the degree of Bologna Process implementation, and international higher education policies.
It is also worth noting that the Bologna Process itself more readily reflects the initial higher education systems of some countries over others, which requires some countries to make more significant and widespread infrastructural and systemic changes.
Countries experiencing the most growth have instituted internationalization strategies, increased the number of programs taught in English, and, in some cases, set up offices in strategic locations to advertise to and recruit students. On the other hand, countries experiencing stagnation or slower growth have faced prohibitive political climates [24], lacked targeted international student recruitment plans [25], and introduced higher fees [26], among other things.
As the Bologna Process continues to evolve and improve its processes in the coming years, and particularly as it works toward its goal of having 20 percent of EHEA [5] students go abroad by 2020, it will need to consider policies that help or hamper international student mobility—and how it may bolster support for the former.
1. [27] Only 37 out of the 48 EHEA countries have data available for both 2011/12 and 2014/15; EHEA countries that did not have data available for both years were excluded from this total.