Chris Mackie, Research Associate, WES
 [1]
[1]
Solid growth in the number of students participating in the Optional Practical Training (OPT) program propped up declining on-campus international student enrollment numbers for the second year in a row, according to the recently released 2019 Open Doors Report [2] of the Institute of International Education (IIE). Even with a strong rise in OPT enrollment, growth in the total number of international students studying and working in the U.S. this past year was marginal, increasing by just 0.05 percent in the 2018/19 academic year.
Although overall growth was tepid, the direction and magnitude of the year-over-year shift varied by academic level, country of origin, and institution and program. A multitude of factors are driving these shifts, some originating far in the past and projecting years into the future, while others are perhaps temporary. The implications of the changing international enrollment environment for U.S. higher education institutions (HEIs), both in the short and long term, are also multifaceted.
Overall Enrollment Trends and the Impact of OPT
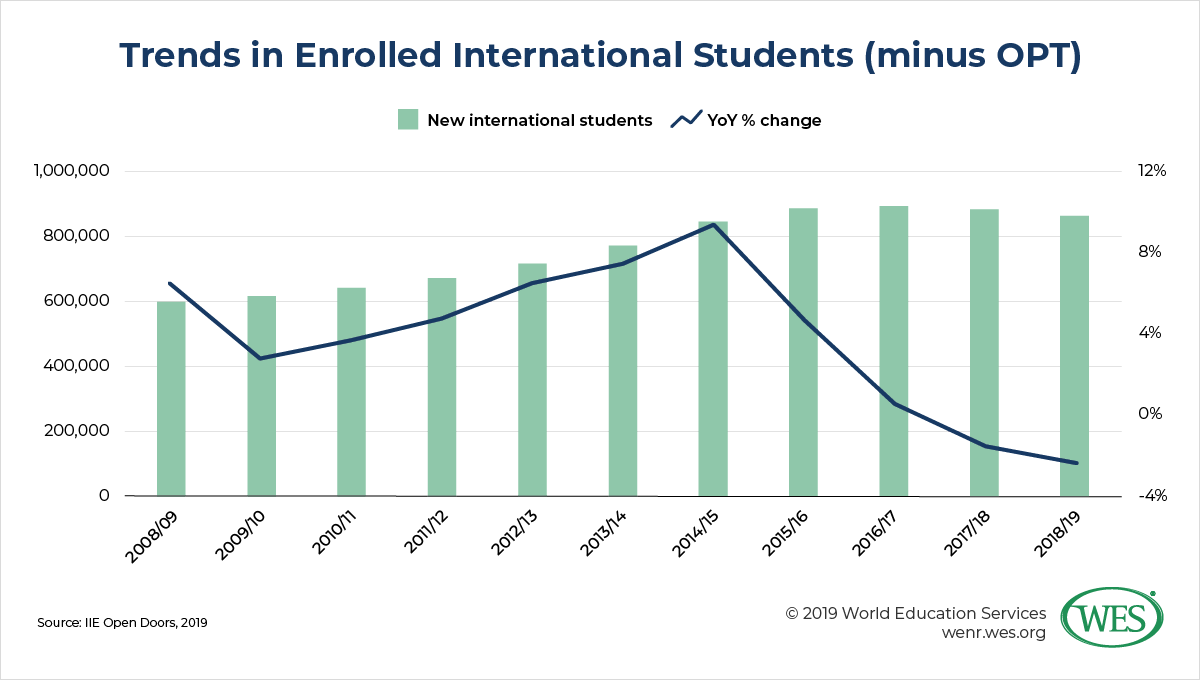
The number of international students in the U.S.–a number which includes students enrolled in academic programs as well as those participating in OPT–grew 0.05 percent, or by just over 500 students, to a total of 1,095,299. Although positive, this year’s growth rate is the lowest since the absolute declines in international enrollment that followed the September 11 attacks. While the total number of international students in the U.S. grew slightly, the number of international students enrolled in academic programs at U.S. institutions actually declined, falling by 2.1 percent (see Figure 3).
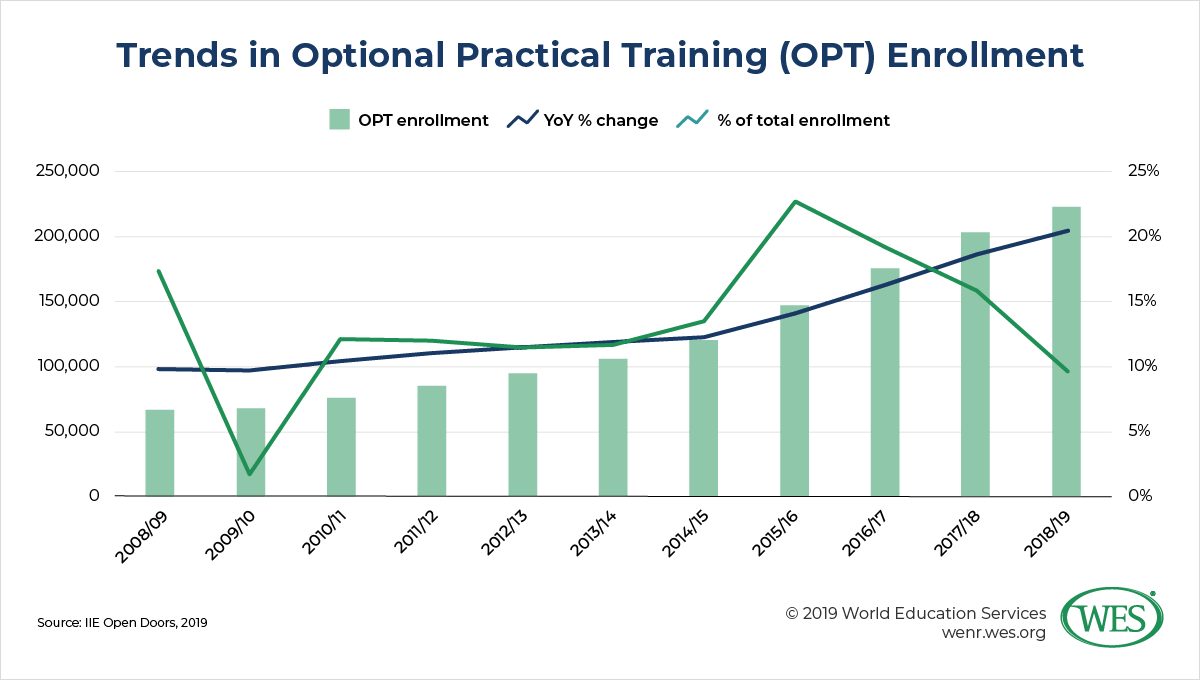
In the face of declining on-campus enrollments, significant growth in OPT enrollment–which allows international students to work in their field of study while in school or after graduation–buoyed total international student numbers. The rate of growth of students participating in OPT peaked at 22.6 percent in 2015/16, following the Obama administration’s decision [3] to extend the program to 36 months for students awarded a degree in a STEM field (see Figure 1). Although the rate of increase has slowed significantly since then, the number of students enrolled in OPT still grew by 9.6 percent, to 223,085, this past year. Long-term growth in OPT enrollment has considerably altered the composition of the international student population in the U.S. Currently, one in five (20.4 percent) international students is enrolled in OPT, more than double the number of a decade before.
 [4]
[4]
However, the future of OPT remains uncertain. IIE’s Fall 2019 International Student Enrollment Snapshot Survey [5]1 [6] suggests a significant slowing in the rate of OPT enrollment growth for the current academic year, with institutions surveyed reporting a modest 2.1 percent increase in the number of international students on OPT in 2019/20. The survey also reports that among institutions experiencing declines in international student enrollments this year, 50 percent cited concerns about the ability of international students to obtain jobs after graduation as one reason for the decline, up from 41 percent two years before. Reports of widespread OPT processing delays [7] and the Trump administration’s proposed restructuring [8] of the program are likely to dull its appeal to many prospective international students.
However, OPT faces an even more ominous challenge. A lawsuit [9] currently making its way through the federal court system threatens to upend the program in its entirety. The plaintiff–the Washington Alliance of Technology Workers, a labor union–alleges that the creation of the program by the Department of Homeland Security did not follow the appropriate statutory process and constitutes an illegitimate usurpation of Congress’s constitutional prerogative to regulate immigration. The plaintiff further contends that OPT is merely a foreign guest worker program in disguise, and that the conditional Social Security and Medicare tax exemptions [10] available to OPT students put American workers at a competitive disadvantage on the job market.
The lawsuit has been met with alarm by U.S. HEIs and international education advocates. During International Education Week [11]–the same week that IIE released its 2019 Open Doors Report–more than 100 colleges and universities in the U.S. jointly filed an amicus brief [12] with the court pleading that the OPT program be upheld. The brief argues that the experiential learning opportunities that OPT affords international students play an indispensable role in providing them with a high-quality holistic education, by allowing them to apply the theoretical knowledge they gain in the classroom to real-world, practical situations. The brief argues that OPT is a natural and necessary extension of the education of international students, citing a recent study [13] which links student participation in internship programs to academic success.
The brief also highlights the damage that ending the program would do to U.S. HEIs’ ability to attract the “best and brightest” international students. Previous WES research [14], cited in the brief, found that international students at the master’s level value career prospects when deciding where to apply and enroll. Participating in OPT unquestionably increases international students’ career prospects. Comparative international studies [15] have also found that limiting post-study work opportunities has a negative effect on inbound international student numbers. In a context of increasingly fierce competition for international students from countries around the world, the brief argues that the OPT program is a vital asset to the U.S. higher education system’s international competitiveness.
New and Total International Student Enrollment Trends
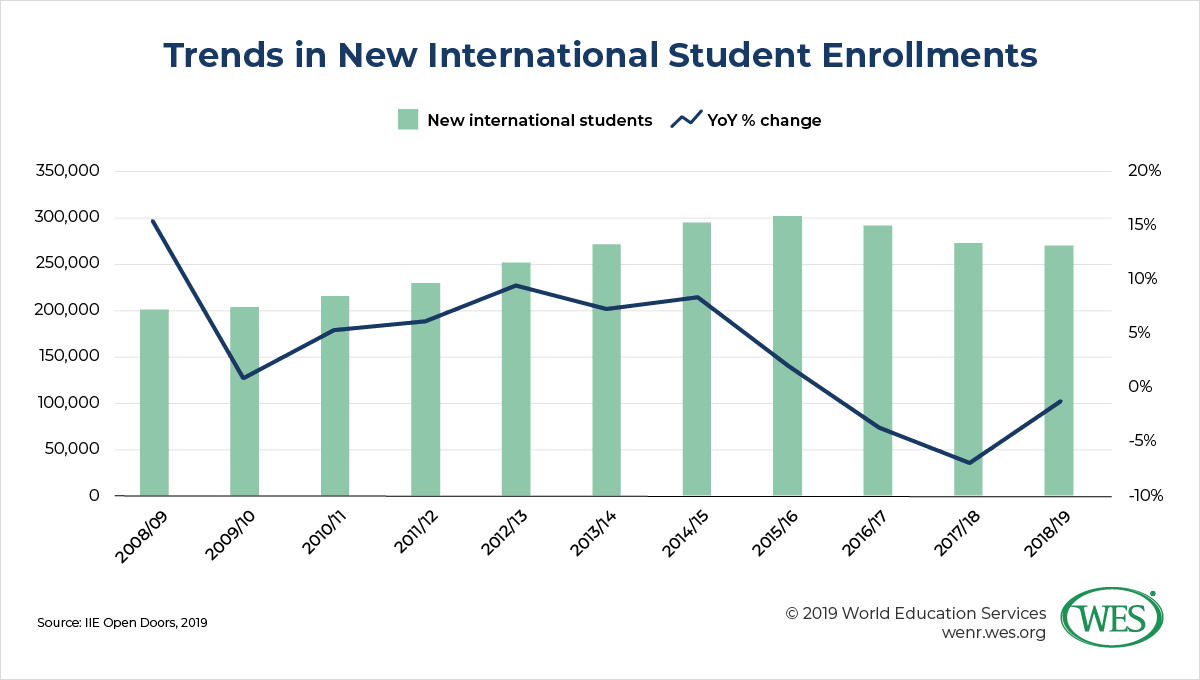
Open Doors data also reveal that enrollments of new international students contracted for the third year in a row, falling 0.9 percent to 269,383 in 2018/19 (see Figure 2). This marks a 10.4 percent decline from the peak year of 2015/16, when first-time international student enrollments reached 300,743. Encouragingly, the 0.9 percent decline was significantly smaller than that of the previous two years, when new enrollments fell 3.3 percent in 2016/17 and 6.6 percent in 2017/18.
 [16]
[16]
For the second year in a row, the number of enrolled international students studying at U.S. institutions (excluding students enrolled in OPT) declined (see Figure 3). The number of enrolled students (excluding OPT) fell 2.1 percent in the 2018/19 academic year, a rate slightly steeper than that of the previous year (-1.3 percent). The heightened pace of the decline is likely the result of years of falling new international student enrollments and the natural attrition of previously enrolled students, through graduation or other means.
 [17]
[17]
Enrollment Trends by Institutional Characteristics and Program Type
The higher education landscape in the U.S. is highly varied and crowded with different types of institutions and a variety of degrees and courses of study. Because of this variability, overall enrollment trends do not affect institutions and programs in a uniform manner. Changes in the overall number of international students studying in the U.S. affect different institutions and programs in different ways.
Academic Level and Institution Type
Growth trends varied by academic level and institution type. While enrollment declined at all academic levels, enrollment at the associate degree level declined the most, falling 10.8 percent between 2017/18 and 2018/19. Enrollment declines at other academic levels were less pronounced; enrollments in non-degree, bachelor’s degree, and graduate degree programs fell 5.0 percent, 0.6 percent, and 1.3 percent, respectively. Among graduate programs, enrollments in master’s degree programs declined by 2.3 percent, while enrollments in doctoral programs increased by 7.4 percent.
A similar pattern is visible when examining growth trends by institutional type. IIE disaggregates its enrollment data by institution type, basing its institutional classifications on the 2018 Carnegie Classification of Institutions of Higher Education [18] which categorizes institutions based on the number and composition of the degrees they award at each academic level. Again, the decline in international student enrollments in Associate’s Colleges was most pronounced, falling 8.3 percent in 2018/19. Enrollments in Master’s Colleges and Universities also contracted, falling by a more modest 1.3 percent. On the other hand, the number of students enrolled in Doctoral Universities increased by 1.2 percent. Among Doctoral Universities, those with Very High Research Activity saw even greater enrollment increases, rising 2.7 percent year-over-year.
These findings suggest that the most prestigious and well-recognized institutions and programs are best positioned to weather an atmosphere of overall enrollment declines, since their reputation remains a draw for international students. This conclusion is backed up by IIE’s 2018 Fall International Student Enrollment Snapshot Survey [19], which found that international enrollments increased at the most selective institutions for the 2018/19 academic year, while they declined at the least selective. The same report found that 47.5 percent of institutions reporting growth in international student enrollment attributed it to the “growing reputation and visibility of their institution,” the second most cited reason for international student growth after “active recruitment efforts.”
Program Focus
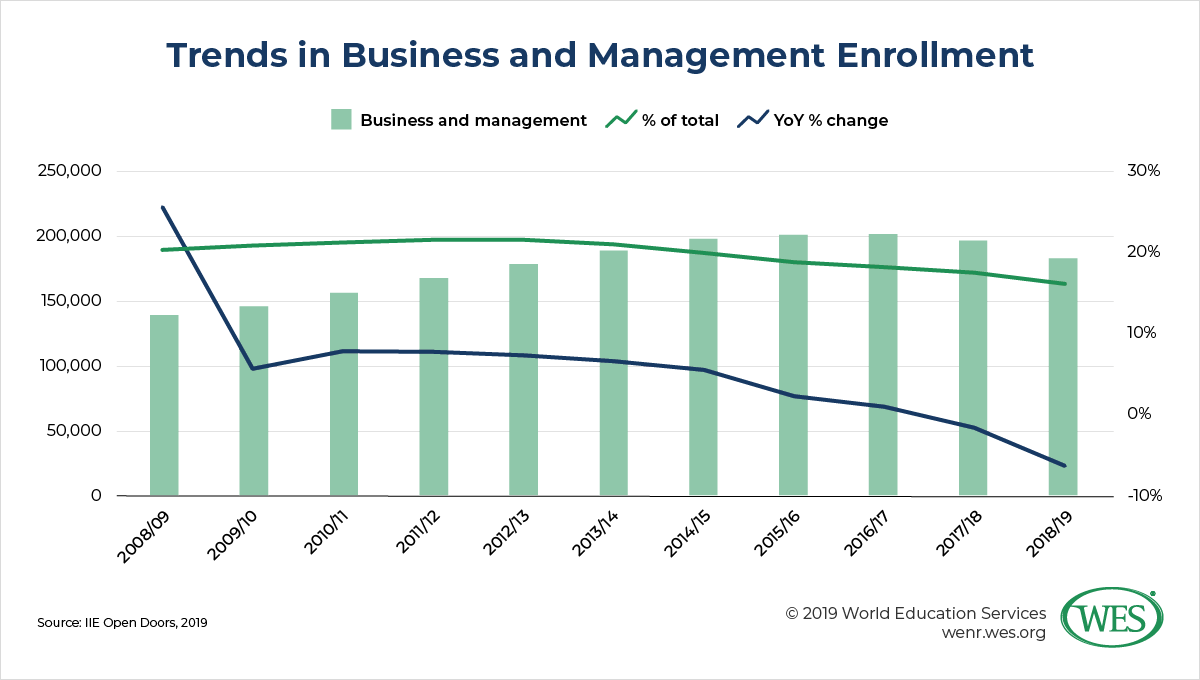
Business and management programs, after more than a decade as either the first or second most popular specialization among international students, fell to third place behind math and computer science programs in 2018/19. Since the share of international students enrolled in business and management programs peaked at 21.8 percent in 2011/12, year-over-year growth has declined continually, turning negative for the first time in 2017/18 (see Figure 4). This past year saw even more drastic declines, with enrollments in business and management programs falling 7.1 percent to 182,170.
 [20]
[20]
Although IIE’s data on specializations are not disaggregated by academic level, the widely reported struggles of graduate business schools help to account for business and management’s declining popularity. A recent report [21] from the Graduate Management Admission Council (GMAC) revealed that 73 percent of two-year MBA programs in the U.S. experienced declines in the number of applications received for the 2019/20 academic year; 74 percent reported declines in international applications. A survey conducted by GMAC [22] earlier this year found that among international students who were interested in applying to a U.S. program but chose not to apply, 50 percent cited concerns about their “ability to obtain a job in the United States post-GME [graduate management education]” as a factor in their decision. The report also notes that while U.S. programs have seen notable declines in international interest, competing programs in other countries, such as those in Canada and Europe, have experienced growing demand from international applicants. The negative impact of student concerns and international competition on international enrollments would only be exacerbated in the event of a curtailment or outright elimination of the OPT program.
Enrollment Trends by Country of Origin
International students come to the U.S. from around the world. Shifting conditions in source countries and changing relations between those countries and the U.S. mean that overall global trends in international student mobility are often refracted through a national lens.
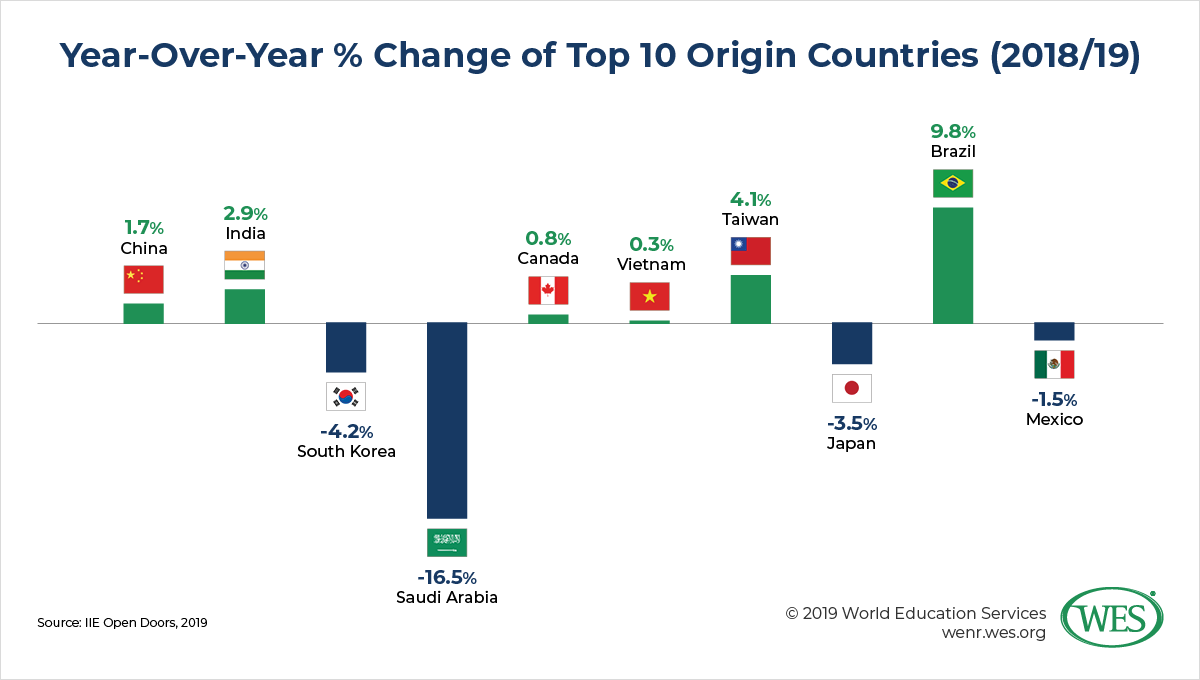
In the U.S., the top 10 sending countries (see Figure 5) account for 71.6 percent of all international students; just two countries, China and India, make up more than half (52.1 percent). The concentration of the origins of international students in a handful of countries means that overall enrollment figures are highly responsive to any sudden shifts in outbound mobility from those top sending countries.
 [23]
[23]
China
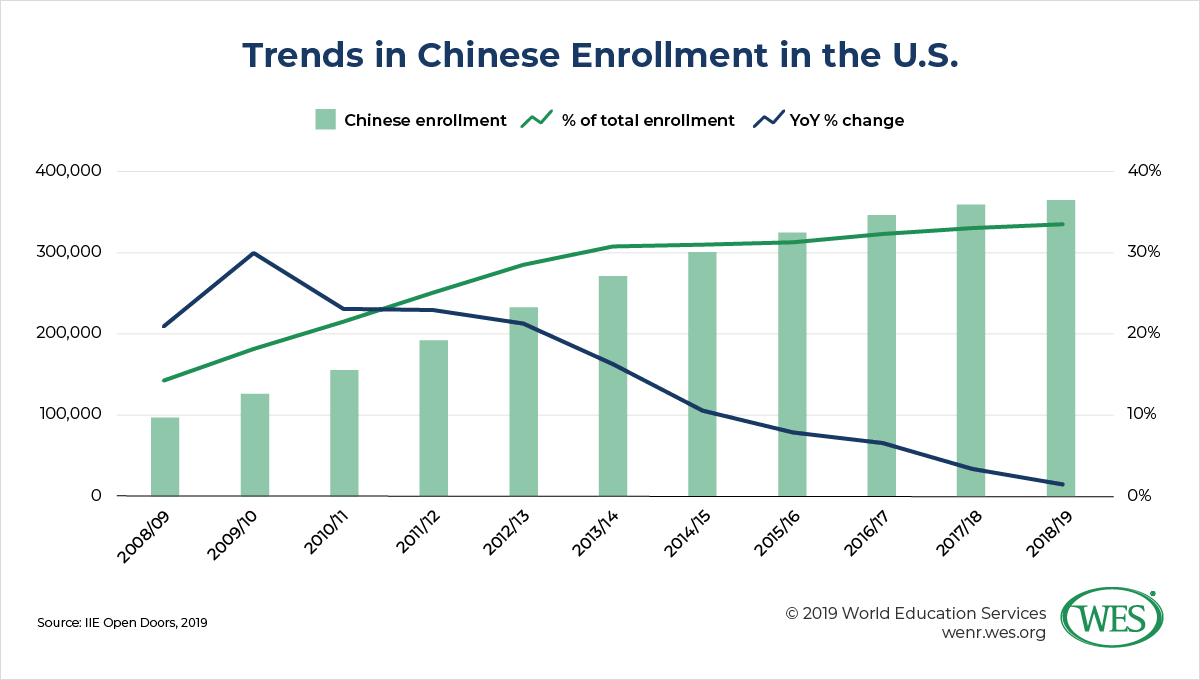
The year-over-year growth rate of Chinese international students peaked in the 2009/10 academic year, when enrollment grew by 30.1 percent from the previous year (see Figure 6). Chinese enrollment growth has declined continually ever since, with the most recent IIE data revealing growth of just 1.7 percent in 2018/19. Excluding OPT, that growth was even lower, with enrollments at the non-degree, undergraduate, and graduate levels rising a mere 0.6 percent collectively. Despite slowing growth rates, U.S. institutions have become increasingly reliant on Chinese students to fill open seats. Chinese students currently make up 33.7 percent of all international students, up from just 14.6 percent a decade earlier.
 [24]
[24]
The causes [25] of the slowing growth rate of Chinese enrollments are various. In recent years, China has found itself the target of the Trump administration’s anti-immigrant rhetoric and protectionist trade policies. These policies have kindled a still simmering trade war [26] between the U.S. and China that is regularly punctuated by announcements of new tariffs and retaliatory countermeasures, and accompanied by increasingly jingoistic political rhetoric. Some of the policies and rhetoric have been expressly aimed at international students and scholars, who, in the U.S., have at times been euphemistically referred to as non-traditional intelligence collectors [27]. This summer, China’s Ministry of Education [28] broadcast a warning to its students that they may be subject to visa issues if they choose to study in the U.S. Furthermore, the Trump administration’s crackdown on Chinese and other international student and scholar visa holders has been widely reported in the national [29] and international [30] press.
The resulting uncertainty is likely to cause Chinese students to think twice before investing in an expensive U.S. education. In fact, IIE’s 2019 Snapshot Report found that of institutions reporting declining international student enrollment in 2018/19, nearly nine in ten (87 percent) cited the visa application process or visa delays or denials as a contributor to enrollment declines at their institution. Fifty-eight percent also cited the social and political environment in the U.S. as a hindrance to international student enrollment. In addition, 80 percent of surveyed institutions were concerned about future enrollments from China, the highest among all listed countries or regions.
Domestic conditions in China also likely play a role in the long-term slowdown in outbound mobility growth rates. As a result of years of low birth rates [31], China is facing the imminent prospect of a contraction in its population size. The country’s age distribution is also swinging upward, further and further away from the typical higher education enrollment age. Furthermore, accompanying the extraordinary transformation of China’s domestic economy in recent decades is a similarly remarkable increase in the quality of its higher education system. China’s top institutions [32] are currently as or even more selective than top Western institutions. Their international rankings also continue to rise year after year. The value of their degrees on the international labor market continues to improve, with recent reports [33] even suggesting that degrees earned at Asian university campuses may be more valuable for Asian students than those earned elsewhere. These developments are likely to further shrink the pool of prospective outbound students and to blunt Chinese students’ interest in looking overseas to further their education.
Similar domestic conditions [34] have long prevailed in South Korea–the third-largest source of international students in the U.S.–and have reduced that country’s overall outbound mobility. The 2018/19 academic year marked the eighth year in a row of declining South Korean enrollments in the U.S., as they fell 4.2 percent to 52,250 students, down 30.4 percent from their peak in 2008/09 at 75,065.
India
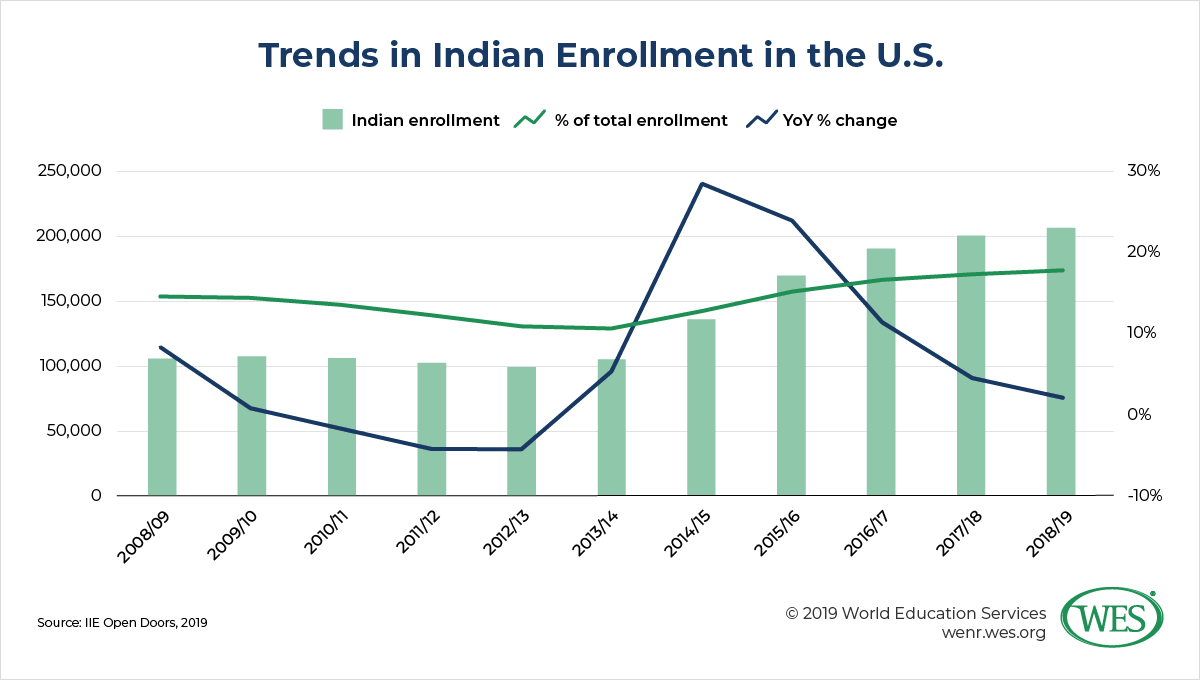
Total international student enrollments from India–the second-largest source of international students in the U.S.–grew slightly faster than those from China, rising by 2.9 percent in 2018/19 (see Figure 7). However, those numbers were buoyed by significant growth in Indian participation in OPT, which increased 12.3 percent from the previous year. Excluding OPT, total Indian enrollment at U.S. institutions actually fell by 2.9 percent in 2018/19.
 [35]
[35]
OPT is a significant draw for Indian students. India’s 84,630 OPT participants comprise 41.9 percent of all Indian international students in the U.S., the fourth highest percentage of any country in 2018/19.2 [36] Any reduction in accessibility to the OPT program–let alone its outright elimination–would have serious consequences for Indian enrollment.
Another potential deterrent to Indian international students is the perceived danger of living and studying in the U.S. A recent WES survey [37] found notable levels of concern over gun violence among Indian students, with more than a quarter (27 percent) reporting concerns over gun violence at their institution. Concerns were even higher in the local community, where more than four in ten (43 percent) Indian students reported being worried about gun violence.
Indian students are also increasingly attracted to institutions in other countries. Australia [38] just reported increases of 31 percent in the number of Indian international students enrolled in its HEIs between August 2018 and August 2019, while Canada [39] saw increases of 40 percent between 2017 and 2018. China [40], even closer to home for Indian students, is also moving aggressively to establish its institutions as a viable alternative to long-dominant Western universities.
U.S. HEIs are concerned about competition from other countries. Fifty-eight percent of institutions surveyed in IIE’s 2019 Snapshot Report cited competition from third countries as a cause of declining enrollments, the second most cited reason for enrollment declines. Among the reasons for the attractiveness of third-country HEIs is their affordability relative to the high cost of higher education in the U.S. Furthermore, many countries, including Australia, Canada, and China, are easing access to their universities and their domestic labor markets after graduation in a conscious bid to attract international students. A combination of these and other factors has already reduced the market share [41] of the U.S. in the global international student market by 6 percent between 2001 and 2018.
The data on international students from India were not all negative, however. While enrollments at the graduate level–at which Indian students have been disproportionately enrolled–declined by 5.6 percent to 90,333, enrollment at the undergraduate level grew for the fifth straight year, rising 6.3 percent to 24,813. India’s growing middle class, which is increasingly willing and able to invest in a prestigious and often costly undergraduate education, may partly explain the rise in undergraduate enrollments.
Saudi Arabia
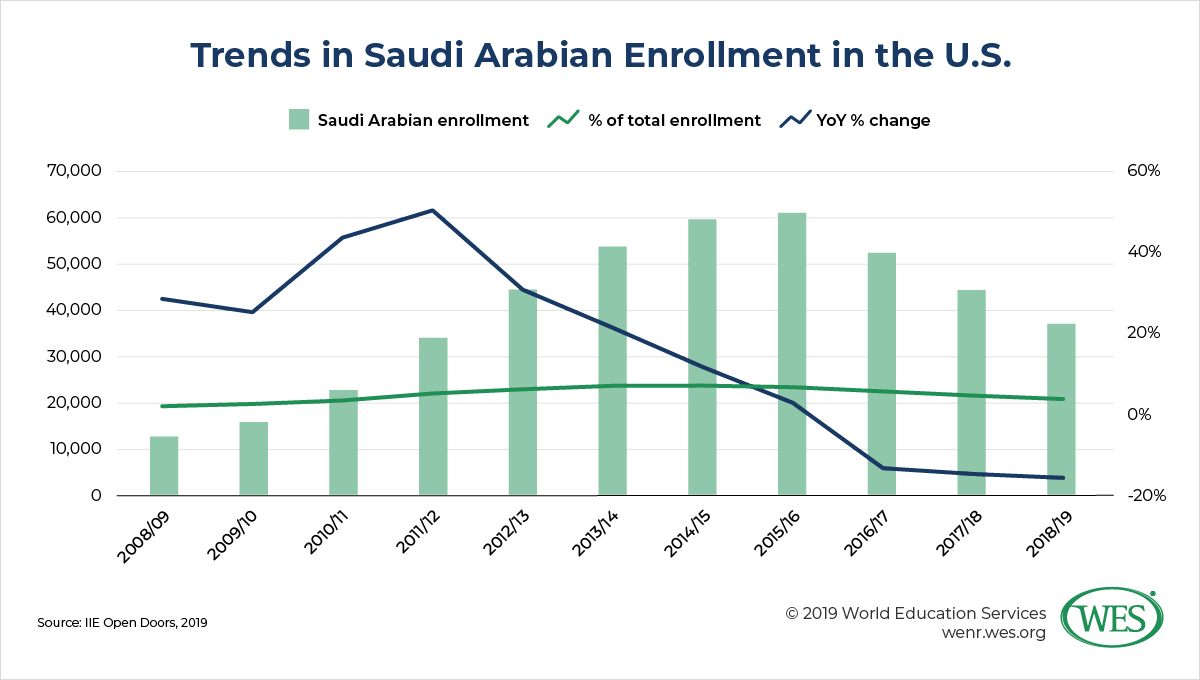
Despite the overwhelming importance of China and India to U.S. international student enrollments, large declines in student enrollments from Saudi Arabia contributed the most in absolute numbers to the fall in total enrolled students this past year. Enrollments of Saudi students declined by 16.5 percent to 37,080 in 2018/19, accounting for 38.5 percent of the total decline, the steepest decline of a single country (see Figure 8). Saudi enrollments [42] are still reeling from an earlier decision by the government to significantly lower its funding of a popular overseas scholarship program.
However, the data also revealed that the precipitous decline of Saudi enrollments at the non-degree level came to an end this past year, a fact that suggests a stabilization in future Saudi enrollment numbers. Enrollment in non-degree programs [43] had often been a first step for Saudi students on their way to enrolling in a U.S. degree program; following the government’s announced scholarship changes, declines at the non-degree level preceded and far outpaced declines at the undergraduate and graduate levels.
 [44]
[44]
Brazil
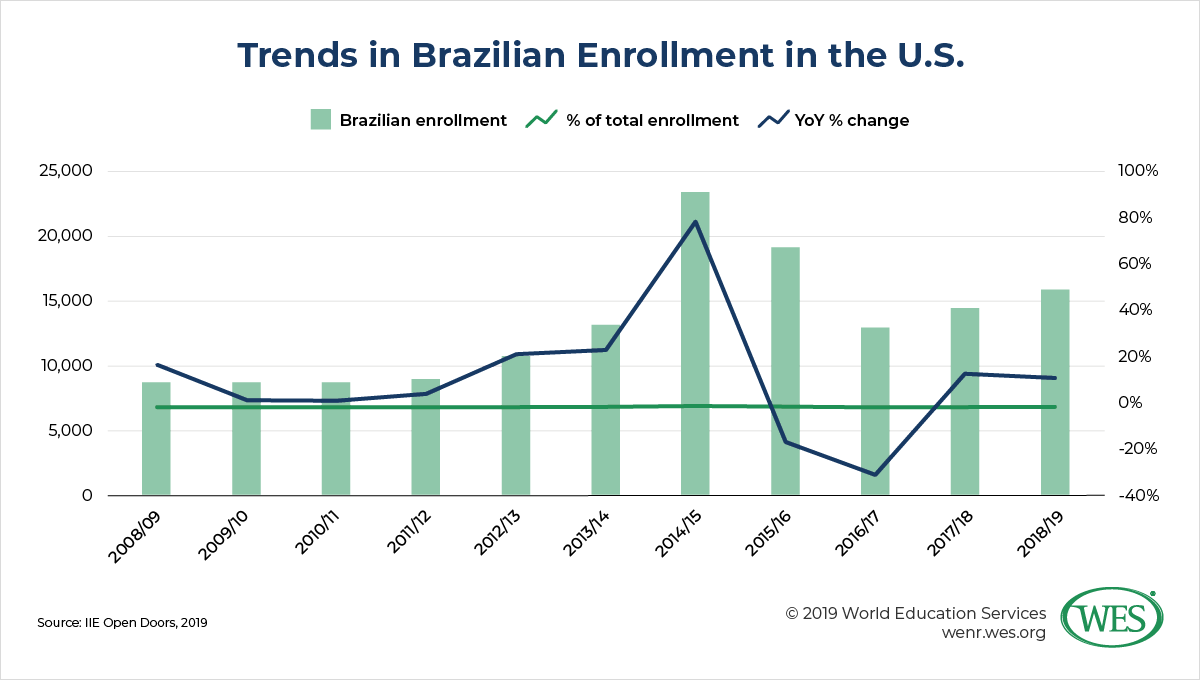
Among the top 10 sending countries in 2018/19, enrollments from Brazil grew at the fastest rate, increasing 9.8 percent to 16,059 (see Figure 9). This marks the second year in a row of Brazilian enrollment growth, an encouraging sign following the collapse in Brazilian enrollment in 2015/16 and 2016/17. As in Saudi Arabia, changes in foreign government-sponsored scholarship programs had a significant impact on enrollments from Brazil. In the wake of the suspension and eventual elimination of the popular government-funded Science Without Borders mobility program [45], total international student enrollments from Brazil dropped 44.7 percent between their peak in 2014/15 and 2016/17 (see Figure 9). Mirroring the experience of Saudi Arabia yet again, Brazilian declines at the non-degree level both preceded and outpaced those at other academic levels, dropping 90.4 percent over that same period, before stabilizing in 2017/18.
 [46]
[46]
Institutional Measures to Mitigate the Decline
While the Open Doors data revealed a continuation of the decline in international student enrollment on U.S. campuses, it also disclosed a significant softening in the pace of that decline. The measures taken by institutions to help their international student populations and to connect with prospective international students have likely played a role in slowing the decline.
IIE’s 2019 Snapshot Report asked institutions with rising international student enrollments about the factors responsible for growth on their campus. The three most cited were:
- “Active recruitment efforts” (54.1 percent)
- “Active outreach to admitted students” (46.6 percent)
- “Growing reputation and visibility of their institution” (35.3 percent)
Institutions also reported taking active measures to mitigate the effects of the social and political environment on current and prospective international students in the past year, including:
- “Alert[ing] students to any changes in U.S. policies” (61.3 percent)
- “Increas[ing] outreach to provide information to current and prospective international students” (54.1 percent)
- “Provid[ing] counseling to international students concerned about the U.S. social and political climate” (48.6 percent)
Conclusion
While the worldwide appeal of a U.S. education remains undeniable, the gravity of the current situation should not be taken lightly. According to IIE data, this is the first time that new international student enrollments have declined three years in a row since that statistic was first reported for the 2007/08 academic year. Findings from IIE’s 2019 Snapshot Report also suggest that the decline could continue into the 2019/2020 academic year, albeit at levels lower than those of previous years. A recent survey [47] of university admissions officers reinforces these findings, with nearly three in five admissions directors reporting concerns about their ability to maintain international student enrollment levels in the 2019/20 academic year.
At a time when many institutions are struggling with stagnating domestic student enrollments, falling public funding, and rising costs, international students play a key budgetary role. Their importance to the internationalization goals of U.S. HEIs is also greater than ever in today’s increasingly interconnected world. HEIs and other organizations concerned about the future of international student mobility to the U.S. must find ways to mitigate the short-term risks to inbound student mobility and prepare for a sustainable future in the face of long-term forces.
1. [48] IIE’s annual Fall International Enrollments Snapshot Reports [49] provide “the international education field with a timely look at current patterns in international student enrollment” as of the fall of the year in which they are released. They are based on the responses of a set of institutions (500 for the 2019 Snapshot Report). The Snapshot Surveys are released jointly with that year’s Open Doors Report, which covers the previous academic year.
2. [50] Only Norfolk Island (100 percent), Saint Helena (62.5 percent), and Seychelles (43.8 percent), the source of 1, 5, and 7 international students respectively, had a higher proportion of their overall international student population enrolled in OPT in the 2018/19 academic year.