 [1]
[1]International enrollment in U.S. higher education is rebounding nicely after more than two years of the COVID-19 pandemic, the new IIE Open Doors Report reveals.
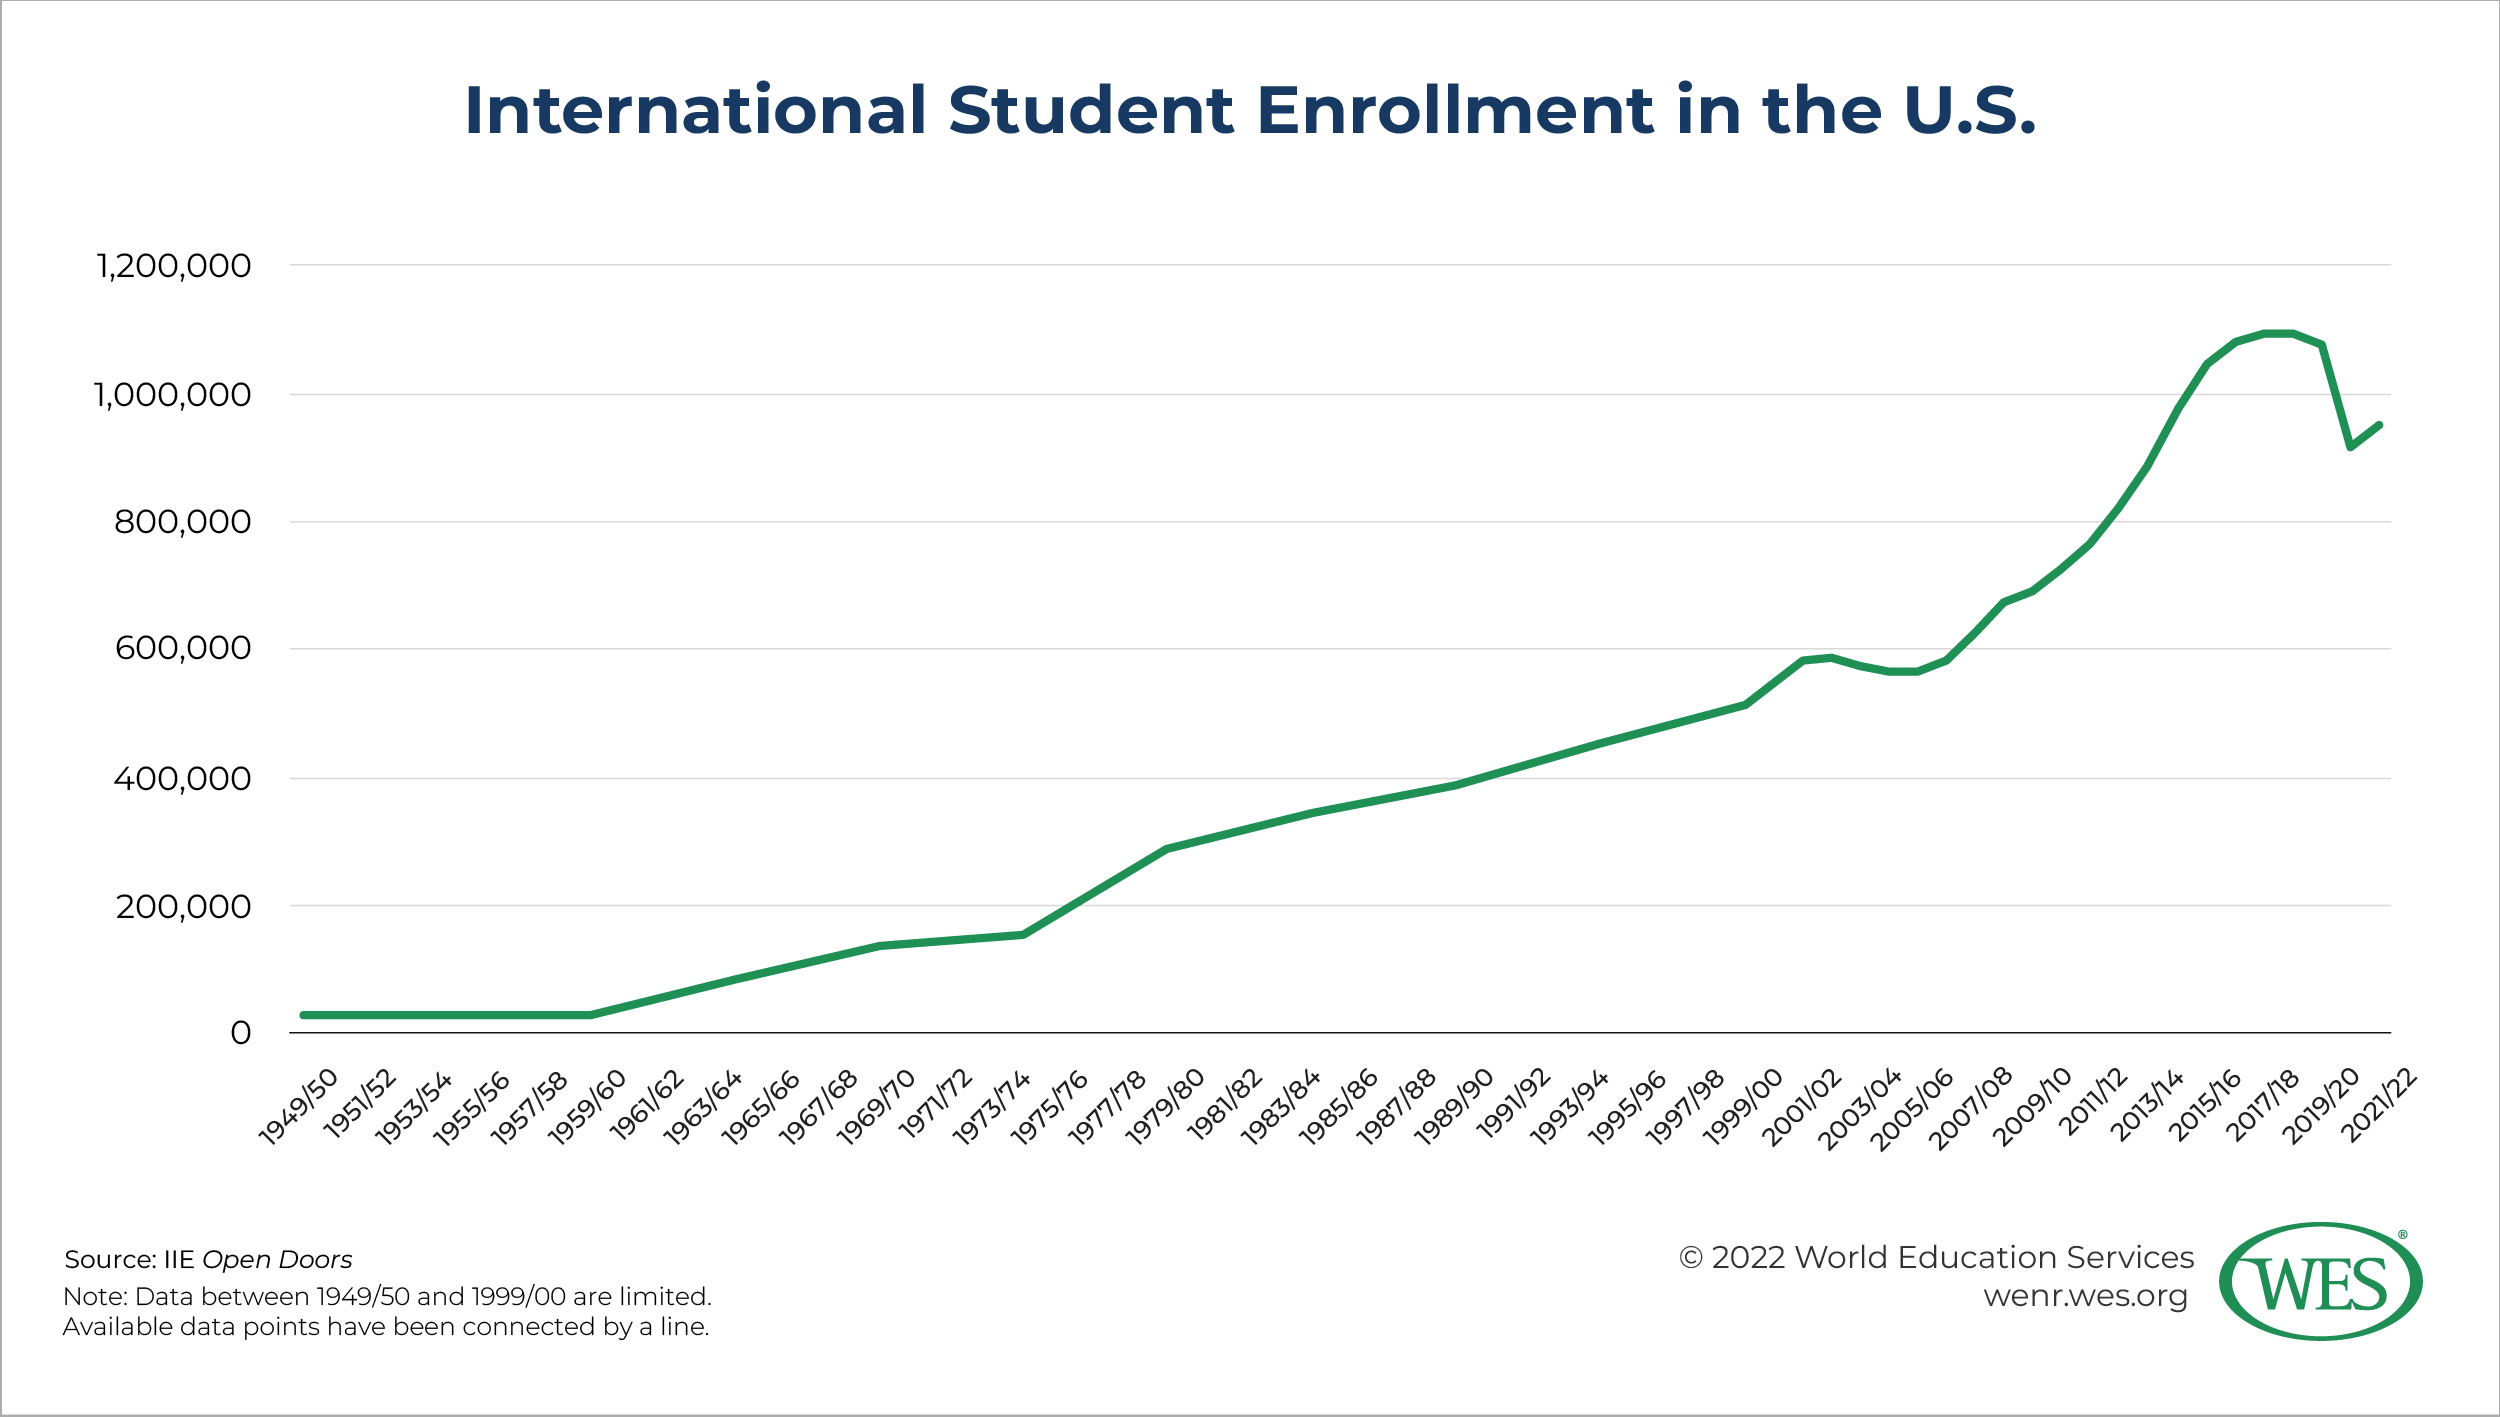
It’s that time of year again: The Institute of International Education (IIE) has released its annual Open Doors Report on International Education [2] (Open Doors, for short)1 [3] for 2022, tracking trends in international student enrollment from the previous academic year, 2021/22. IIE has also released its 2022 annual Fall Enrollment Snapshot Survey report [4]. The biggest takeaway: At least in the immediate term, international enrollment in U.S. higher education is rebounding nicely after more than two years of the COVID-19 pandemic. International enrollment grew by 3.8 percent from the mostly pandemic-induced low of 914,095 in 2020/21 to 948,519 in 2021/22. And the snapshot survey found 9 percent growth in total international students in fall 2022.
 [5]
[5]
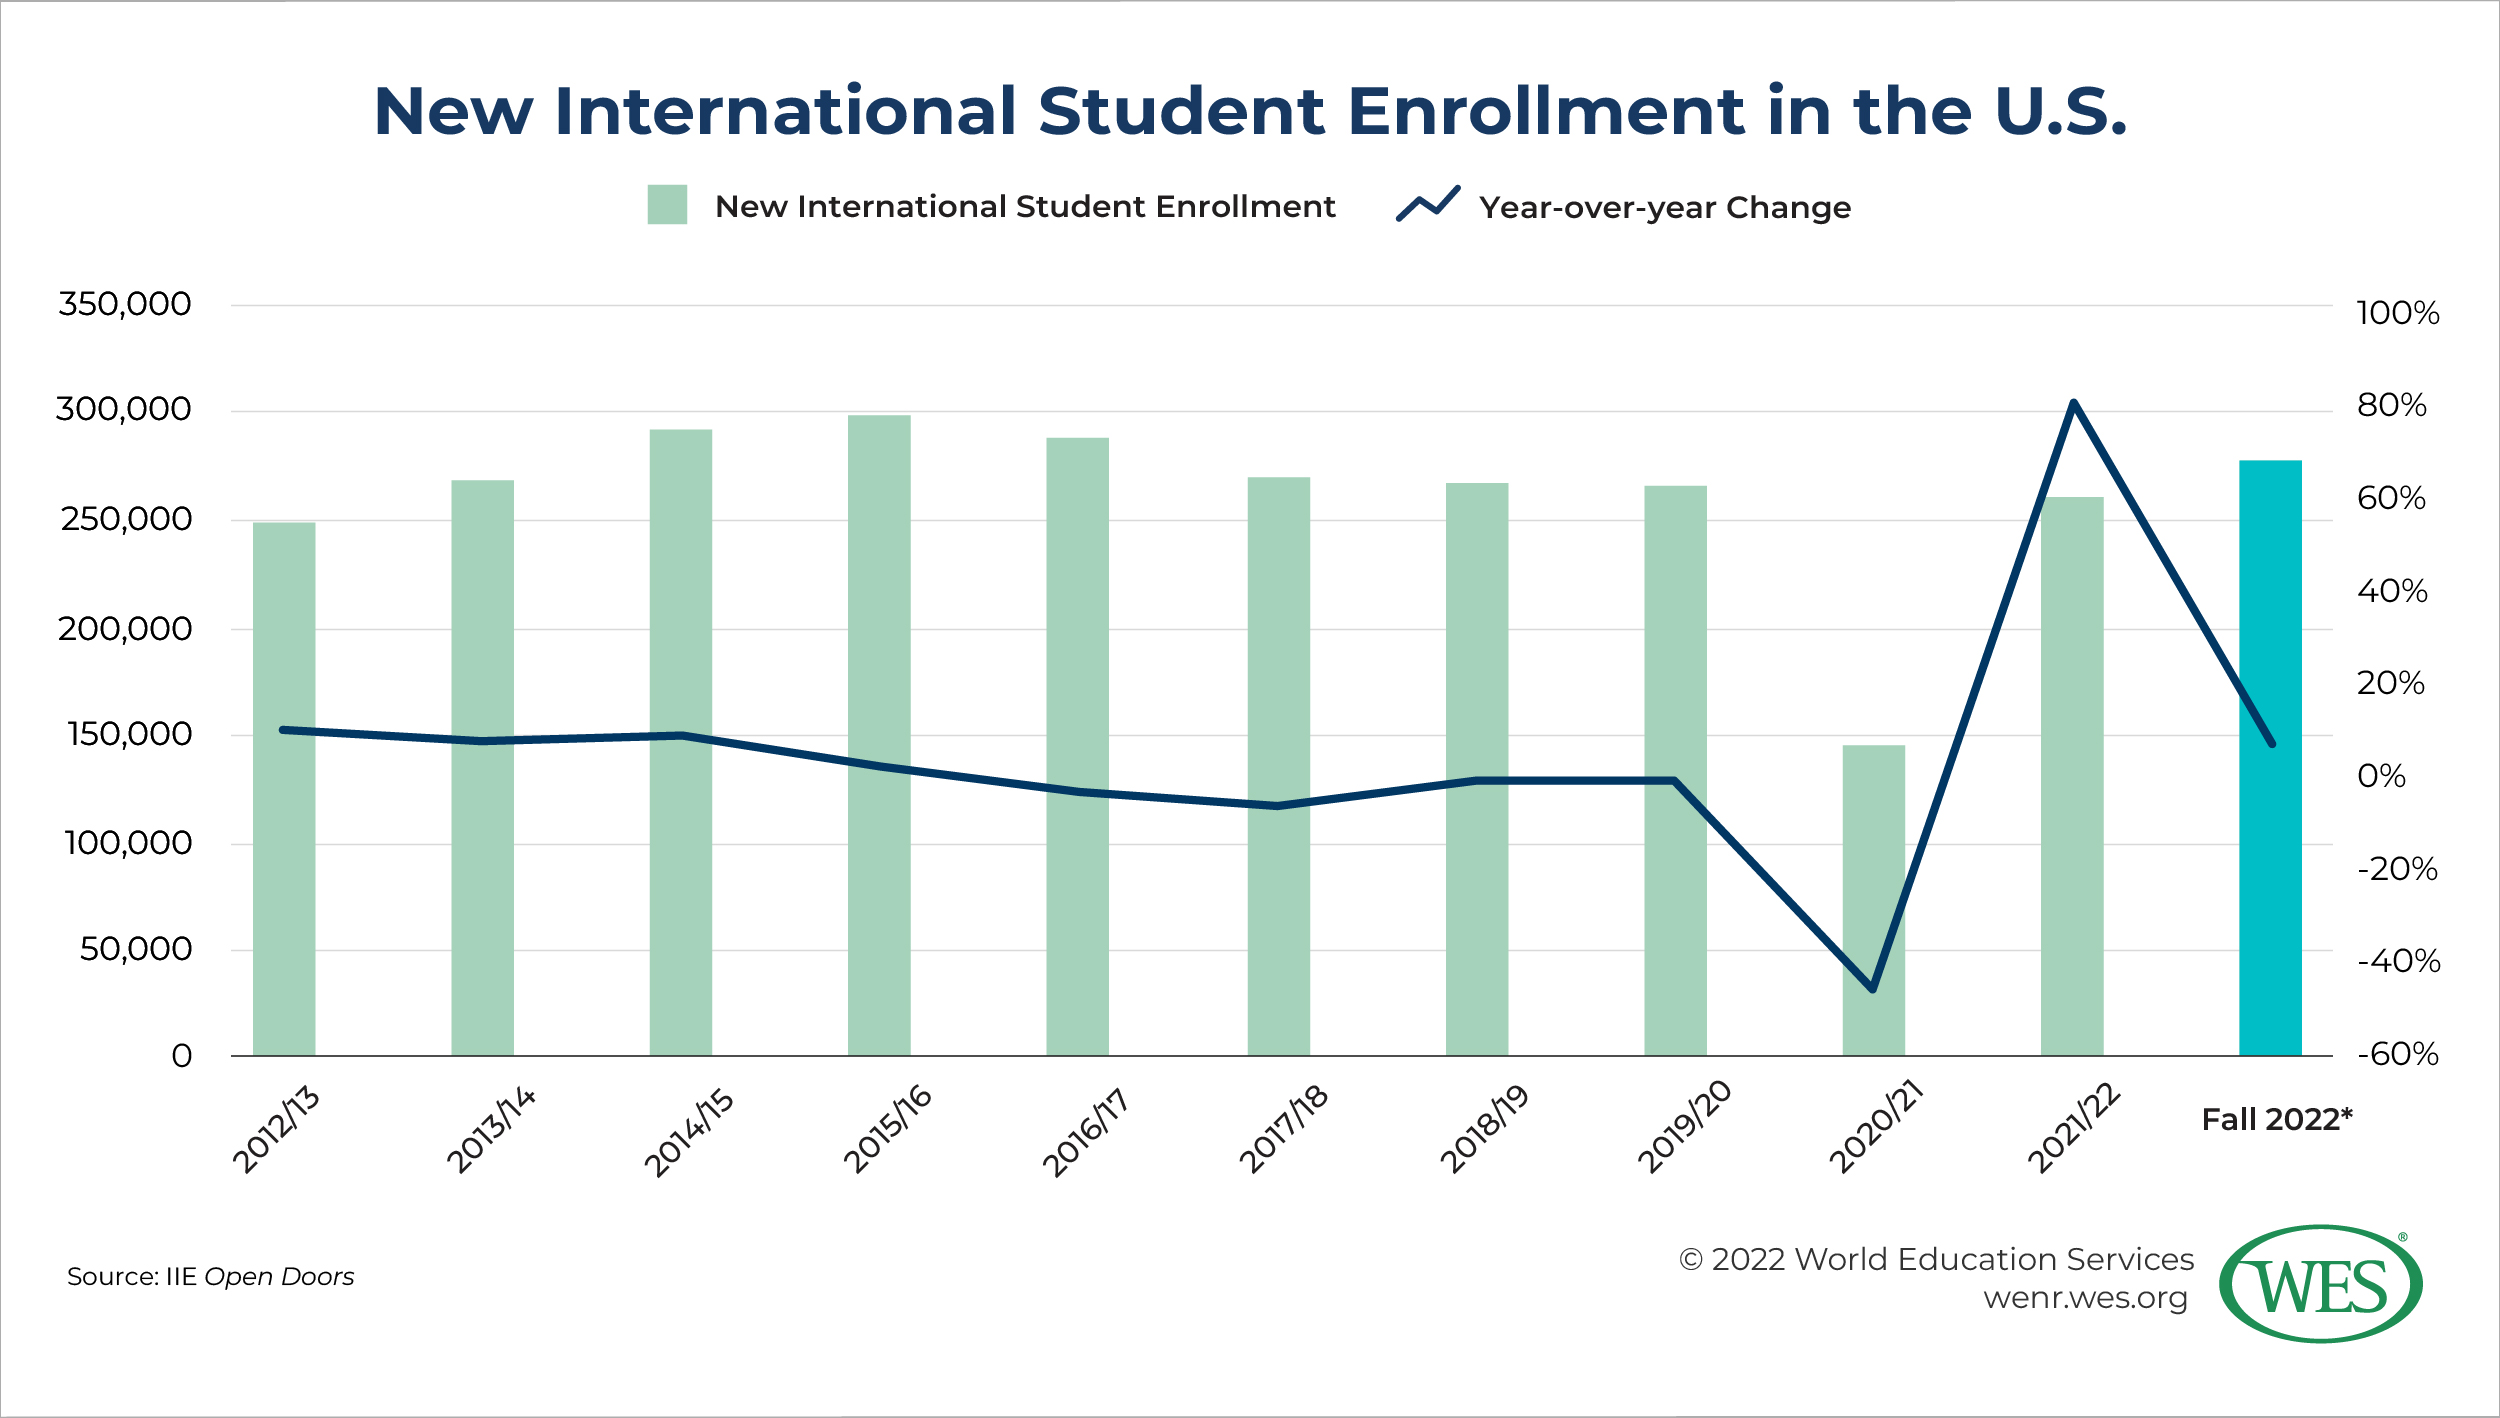
In particular, new student enrollment grew by 80 percent in 2021/22, signaling a major recovery. This fall, there has been a 7 percent increase in new students, according to the Fall Snapshot Survey. Sixty-three percent of responding institutions indicated an increase in the number of new international students for Fall 2022. First-time graduate enrollment has mostly fueled this growth, expanding by 122 percent in 2021/22, while new enrollment in non-degree programs [6], mostly short-term exchanges and English language programs, grew by about 142 percent.
Although new student enrollment in undergraduate programs grew 31 percent, total undergraduate enrollment still decreased by 4.2 percent, with the largest decreases at the associate degree level. In many major sending countries around the world, such as India, undergraduate education is much easier to access domestically and is almost always much cheaper. By contrast, many education systems have less capacity at the graduate level. As a result, U.S. graduate education, particularly at the master’s degree level, has proved to be a relatively strong draw for many international students.
 [7]
[7]
The growth after a year of unprecedented decline in 2020/21 certainly reflects at least a partial return to normalcy following the worst of the pandemic, first shown in IIE’s 2021 Fall Snapshot Report [4]. It reflects, in large part, a release of pent-up demand, as many international students deferred enrollment during the pandemic until conditions improved, and many are now taking the opportunity to enroll at. U.S. colleges and universities have almost completely returned to in-person classes or hybrid models, with less than 1 percent exclusively offering online courses in fall 2022.
The hope is that growth will continue as the pandemic fades into the past. As IIE president Allan Goodman said [8], “[The over one hundred years of IIE Open Doors] data takes us through twelve pandemics, starting with the 1918-1920 Spanish influenza. During each, academic exchanges continued, and when public health conditions permitted, rapidly resumed and then exceeded pre-pandemic levels. [This year’s data] are fully consistent with this pattern, and they demonstrate the commitment by international students to studying here and by U.S. colleges and universities to keeping their doors open.” Other factors than the pandemic play roles, of course, and continued growth is not certain. But for now, the outlook is good.
Here are a couple of other notable takeaways:
Continued Declines in Chinese Enrollment
Enrollment has rebounded across almost all world regions and among most major sending countries. But one notable trend is that Chinese student enrollment continues to decline at a steady rate. In 2021/22, the total number of Chinese students decreased by nearly 9 percent to 290,086. The overall decline was driven primarily by decreases in the number of Chinese undergraduates. Graduate enrollment grew modestly.
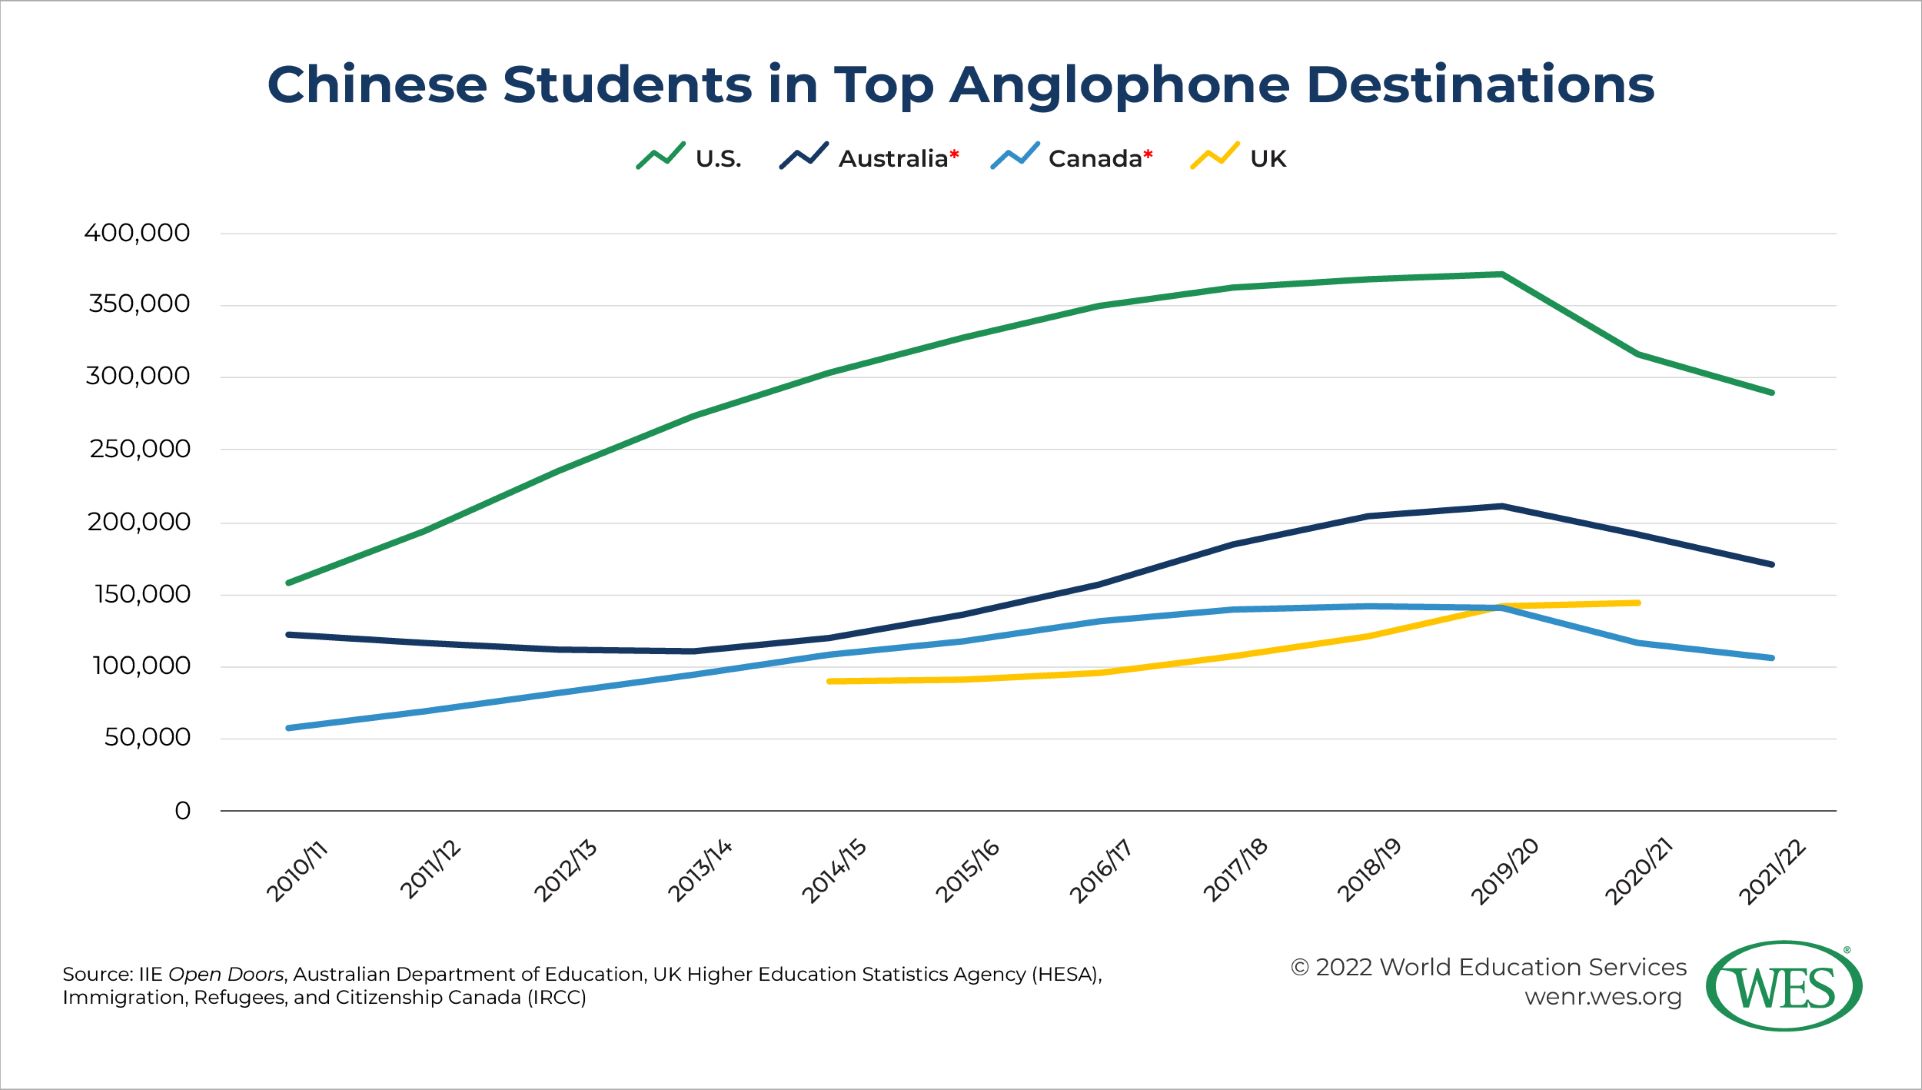
It’s difficult to know if this trend is predominantly a continued outcome of the pandemic or if it is a longer-term trend. In the previous decade, Chinese enrollment grew tremendously, from less than 200,000 in 2011/12 to a peak of 372,532 in 2019/20. But in the few years before the pandemic, the number of Chinese students began to level off, with a growth rate of less than 1 percent in 2019/20 (the academic year whose end coincided with the first few months of the pandemic). Analysis of available data [9] from SEVIS (the Student and Exchange Visitor Information System) indicates a further decline in Chinese enrollment for fall 2022 [10], with about 244,000 SEVIS higher education records for Chinese students, down from approximately 247,000 in fall 2021 [11].
 [12]
[12]
Data from the U.S.’s three main (predominantly) Anglophone competitors—Australia [13], Canada [14], and the United Kingdom (UK) [15]—show that similar trends among Chinese students. Chinese enrollment in Australia and Canada similarly peaked in and declined through 20212 [16], even while other national groups have rebounded. Data from the U.K.’s Higher Education Statistics Agency (HESA) is a bit more limited in scope3 [17] but shows slight increases in the number of Chinese students in the U.K. during the same period. British Council data reported in IIE’s Project Atlas [18] indicates modest growth in Chinese student enrollment in 2022. One potential reason for the U.K. faring better with Chinese students than its main competitors is possibly the way the country responded to the pandemic [19] and provided particular assistance to international students.
A very complex mixture of shorter- and longer-term factors, of which the pandemic is only one, affect Chinese enrollment. These include economics, the sociopolitical environment in the U.S., the geopolitical relationship between China and the U.S., and educational and social factors within both countries, some of which I discussed this time last year [20]. Some examples include the recent economic slowdown [21] in China (in part due to the country’s “zero COVID” policy [22]), strict Trump-era policies [23] towards Chinese students (some of which the Biden administration briefly continued [24]), perceptions around safety [25] in the U.S. (due to anti-Asian racist incidents and gun violence, in particular), renewed tensions between the two countries [26] (particularly over the status of Taiwan [27]), and increasing access [28] and improving quality [29] within the Chinese higher education system, which may incentivize more students to stay at home [30] to study. Additionally, many Chinese students are starting to consider other countries [31], such as the UK and Singapore, for the above reasons.
It is not clear if this decline will continue, but there are some bright spots for U.S. higher education. While there is an uptick in interest in other countries among Chinese students, there is still evidence [32] that the U.S. is a top desired destination, if not the top destination. The time horizon for planning for international education tends to be much longer among Chinese students and their parents, with many planning on coming to the U.S. since they were young. Additionally, U.S. higher education is still among the most prestigious worldwide, with the top number of internationally ranked universities, factors that tend to be important to Chinese students [33]. And the size and diversity of U.S. higher education is unmatched by other countries, providing international students with a wealth of options in terms of institutions, programs, and majors. For now, too, China is by far the top sending country to the U.S.
The Rise of Indian Students
In contrast to Chinese students, Indian student growth shot up almost 19 percent to 199,182 in 2021/22. This is quite close to the all-time high of about 202,000 in 2018/19. As always, Indian enrollment is driven mostly at the graduate level. In fact, graduate enrollment among Indians grew by almost 50 percent in 2021/22. Indian students continue to study math and computer science and engineering at higher rates than students of most other major sending countries.
A brief dip in Indian enrollment began in 2019/20 before accelerating during the worst of the pandemic in 2020/21. COVID-19 is of course responsible for much of this slump. But some of the declines may have been driven by other factors as well, most notably the Trump administration’s restrictive changes to the H1-B visa program [34] and its proposal to scale back or end OPT [35], two work opportunities popular with Indian students. The Biden administration has rolled back these policies [36], likely inspiring more confidence in the U.S. among Indian students, who are known to favor work opportunities in the U.S. after graduation.
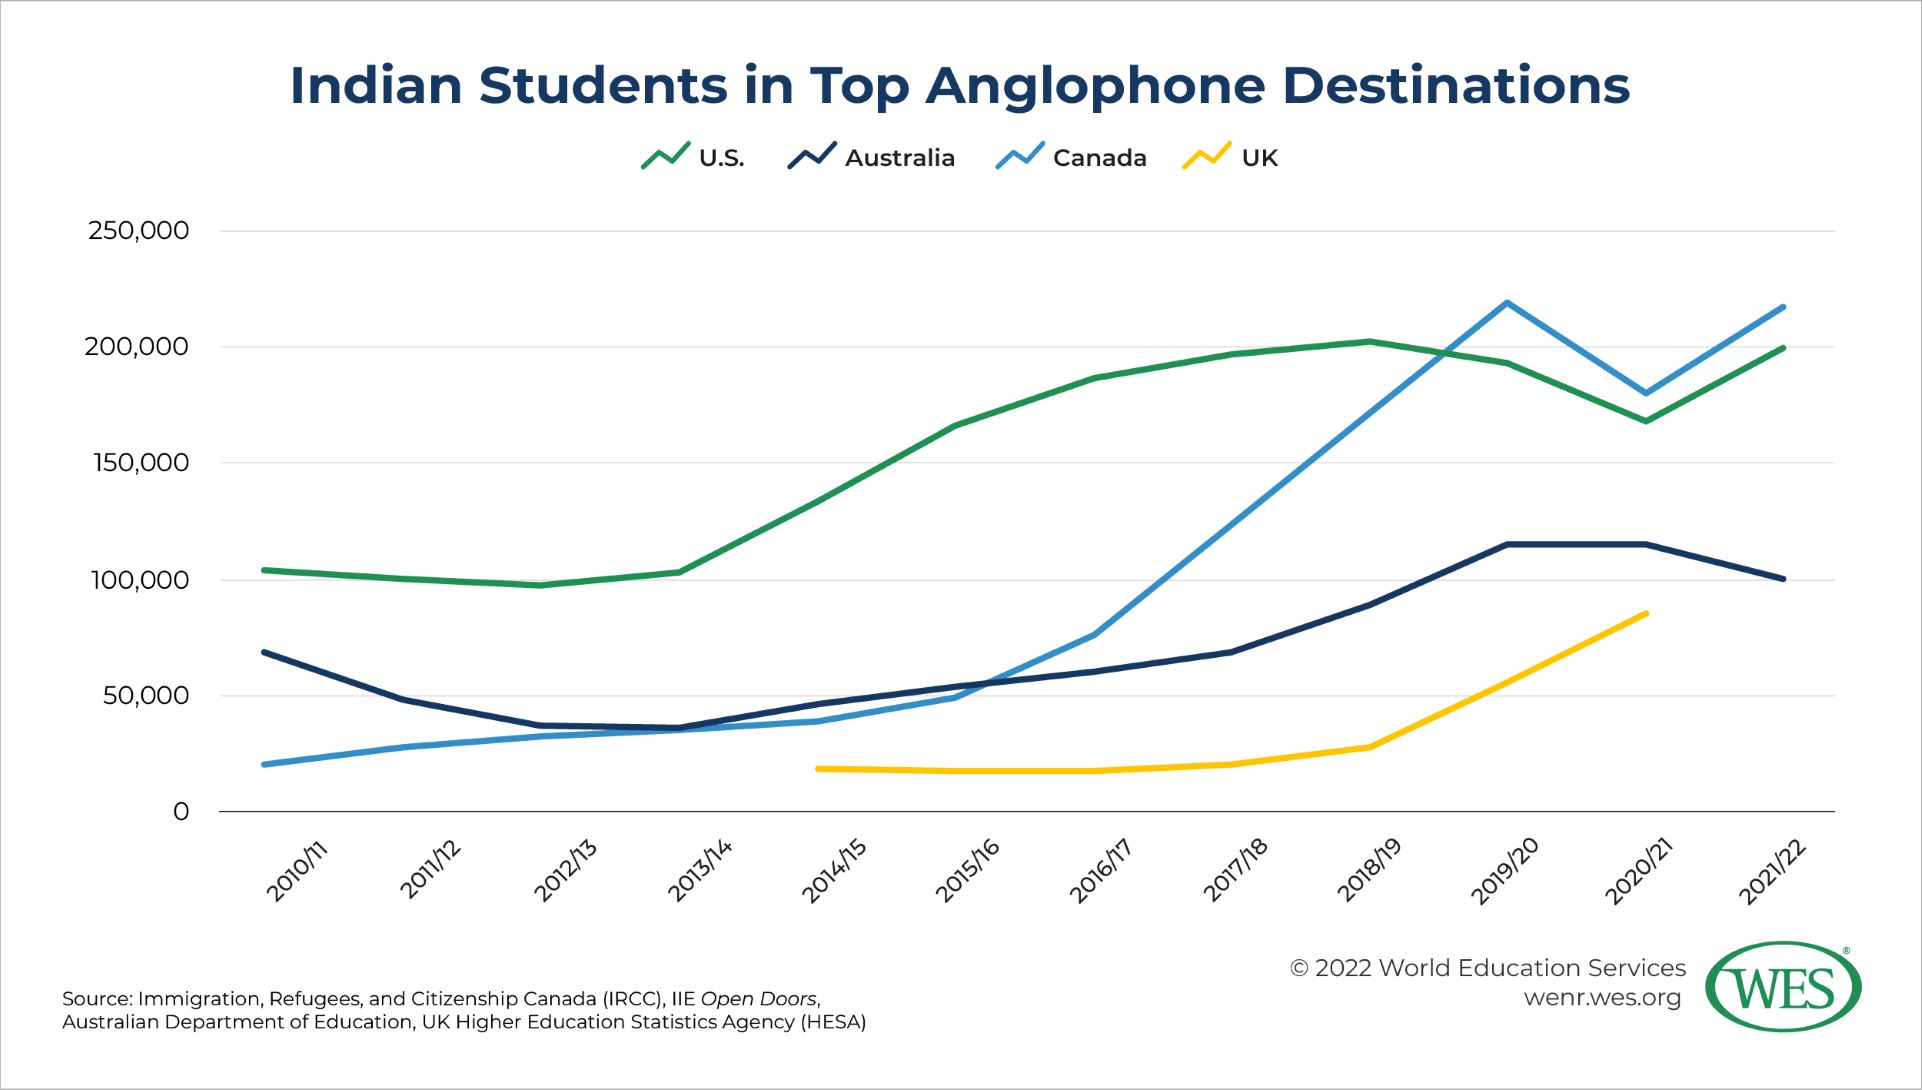
For now, at least, there are strong signs that Indian enrollment growth will continue. An analysis of SEVIS data [9] shows about a 27 percent growth in Indian enrollment in U.S. higher education from 2021 to 2022. However, other destinations are providing stiff competition. Most notably, Canada has overtaken the U.S. as the top study destination for Indian students, according to Canadian government data [14]. From 2010 to the peak in 2018, Indian enrollment in the U.S. about doubled, but in Canada from 2010, it grew more than 10-fold to its peak in 2019, when Canada first surpassed that of the U.S. (Both countries lost enrollment during the maelstrom of 2020 and have since rebounded.) In 2021, there were 217,410 Indian students in Canada, over 18,000 more students than in the U.S. (though the Canadian data include some K-12 students that cannot be disaggregated). And India is now the top country of origin among all international students in Canada.
 [37]
[37]
The reasons for Canada’s popularity as a destination for Indians are multifaceted, but Canada’s more generous pathways [38] for work experience and permanent residency for international students are a big draw for Indians. The country continues to roll out new policies such as lifting the cap on the number of hours that international students can work while studying and implementing strategies [39] for increasing the pipeline to permanent residence. The U.K. [40] and Australia [41] have also developed work and residency pathways for their international students. The U.S. has not done the same, and it may hurt international student enrollment, particularly of Indian students, in the long run.
Other Changes by Country and Region
There was growth in most of the world’s regions in 2021/22. South and Central Asia grew by 18 percent, fueled heavily by India but also by other South Asian countries. Enrollment grew from Nepal by 5.6 percent, Bangladesh by 23.2 percent, and Pakistan by 17.4 percent, taking the 12th, 13th, and 16th top spots among source countries, respectively. IIE has previously identified [8] Bangladesh and Pakistan as major emerging markets for U.S. higher education.
On a percentage basis, the largest growth came from Europe, with more than 22 percent annual growth. Most of the top European sending countries posted robust year-over-year growth: the UK (28.2 percent; in the 14th top spot), Germany (59.4 percent; 17th), Spain (41.2 percent; 19th), France (37.4 percent; 22nd), and Italy (16.4 percent; 25th). Turkish enrollment grew a bit more modestly, at 4.4 percent, putting it in the 18th spot. In particular, European enrollment in non-degree programs (such as short-term exchanges and English language programs) shot up over 400 percent, after a steep decline during the pandemic. More than those from any other region, Europeans are more likely to participate in non-degree programs in the U.S., mostly for academic credit back home, though the majority of Europeans come for full degrees.
The one region to register major declines in 2021/22 was the Middle East. There was an overall slide of nearly 10 percent, and the top countries of origin from the region all contracted: Saudi Arabia by 17 percent, Iran by 3 percent, and Kuwait by nearly 14 percent. In the cases of Saudi Arabia [42] and Kuwait [43], changes to major government scholarship programs have largely fueled these long-running declines.
The Decline and Possible Growth of OPT
In 2021/22, participation in Optional Practical Training (OPT) slipped for the second year in a row. This is an aftereffect of the recent loss in new student enrollment prior to 2021. The good news from the fall Snapshot Survey is that OPT participation has grown by 6 percent in fall 2022, indicating a likely rebound. This rebound is likely fueled by the very recent growth in master’s degree students [8], most of whom only spend one to two years on campus and then are ready to enter the job market, often starting with OPT. The Biden administration’s expansion of OPT [44], notably its expansion of the number of fields of study that qualify for the popular STEM OPT extension which allows participants to work up to an additional two years, will likely help as well.
The U.S. Share of Global Mobility
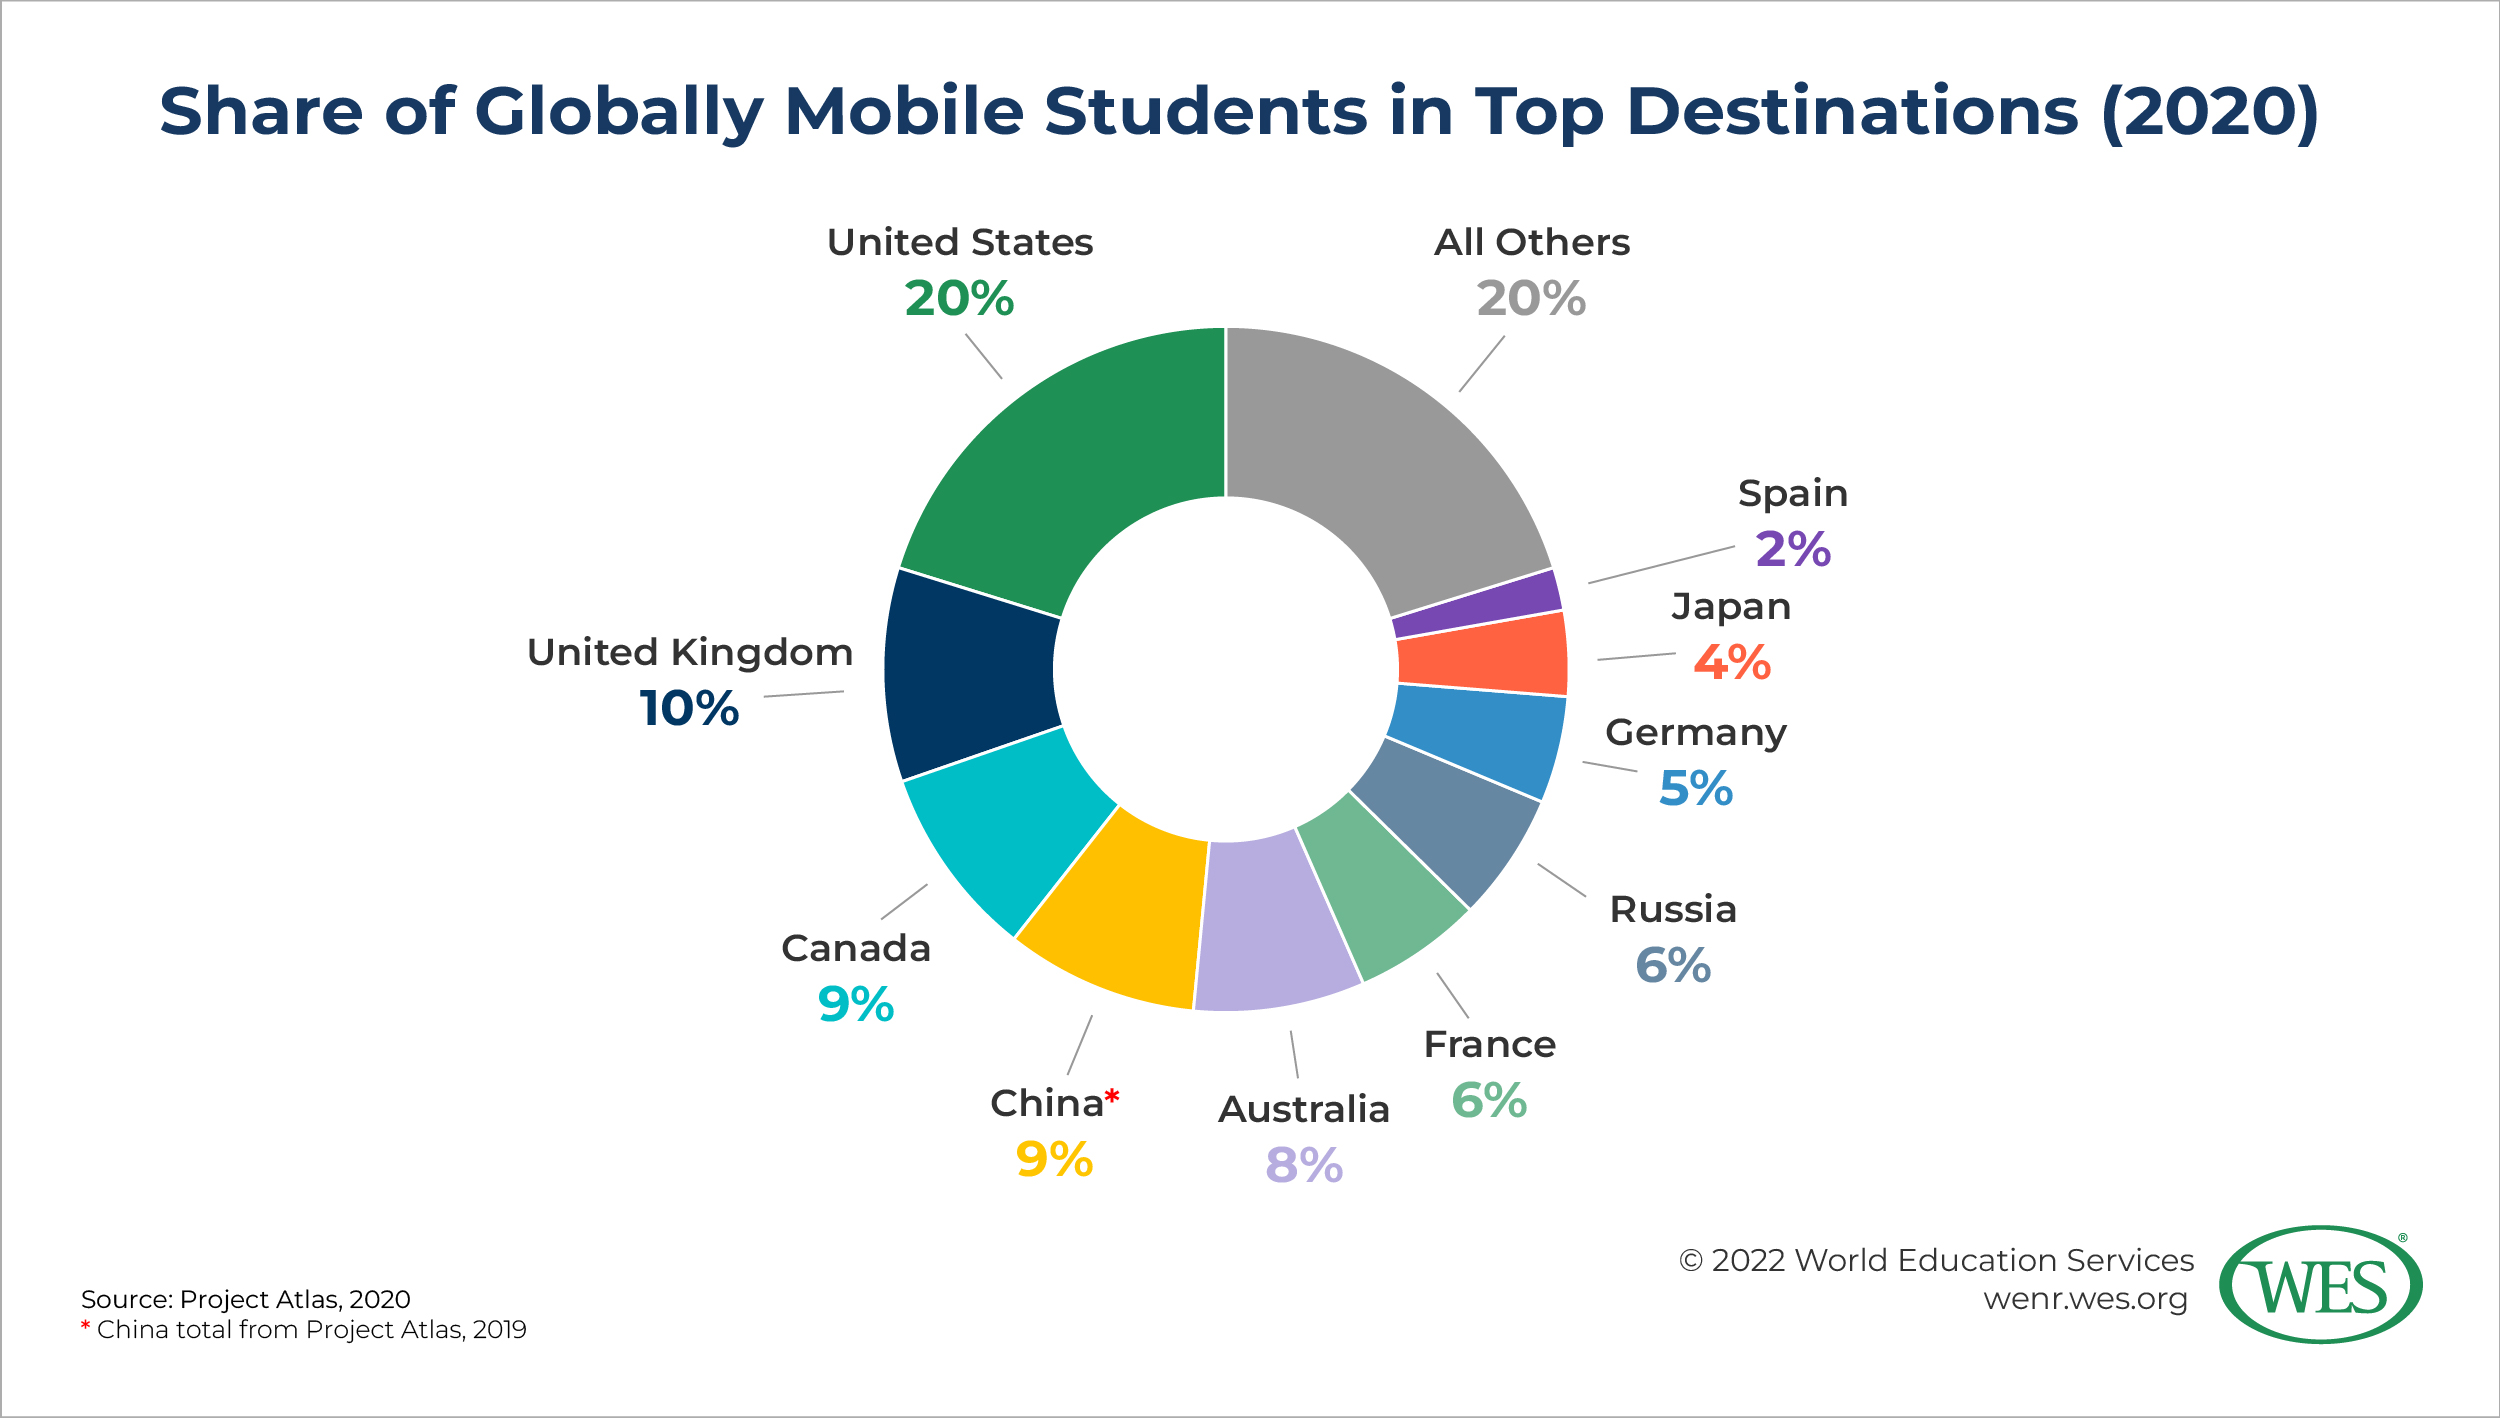
In its briefing for Open Doors 2022 [8], IIE also reported data on global mobility from its Project Atlas [45]. Among the big takeaways, global student mobility has grown steadily over the past few decades, though current data do not take into account the COVID-19 pandemic. The U.S. remains the top destination for students by a large margin. However, the U.S.’s share of all globally mobile students continues to shrink. In 2022 [8], the U.S. hosts about 15 percent of all globally mobile students. This is down from [46] 20 percent in 2020 and 28 percent in 2000.
 [47]
[47]
At the same time, compared with the other major Anglophone destinations, the U.S. hosts a far smaller share [8] of international students relative to its total higher education population, at about 5 percent. By contrast, 23 percent of higher education enrollment in the U.K. is international, while in both Australia and Canada, 25 percent of enrollment is international. As IIE reports, this means that there is more room for the U.S. to absorb international students into its large and diverse college and university system, a major advantage over most other countries.
Looking to the Future
It appears that the immediate headaches of the COVID-19 pandemic are receding, and international enrollment is rebounding. However, the pandemic is far from the only factor that impacts enrollment; the pandemic is also far from being fully over. U.S. institutions should continue to be proactive in their outreach and support of international students. Despite the tough environment coming out of the pandemic—from economic troubles (including a possible recession [48]) to geopolitical struggles—the U.S. will certainly continue to be an attractive destination for international students looking for a top education and a wide variety of choices.
1. [49] Open Doors is an annual census of international student (those on a nonimmigrant student visa) enrollment in U.S. higher education institutions, as well as U.S. students who studied abroad two academic years prior.
2. [50] The Australian and Canadian governments report their international student data by calendar year, while data from the UK and U.S. are reported by academic year. I have paired calendar year data from Australia and Canada with the corresponding year of fall enrollment in the UK and U.S. For example, 2019 data from Canada would be paired with 2019/20 data from the U.S.
3. [51] Data from the UK’s HESA are not yet available for 2021.