 [1]
[1]
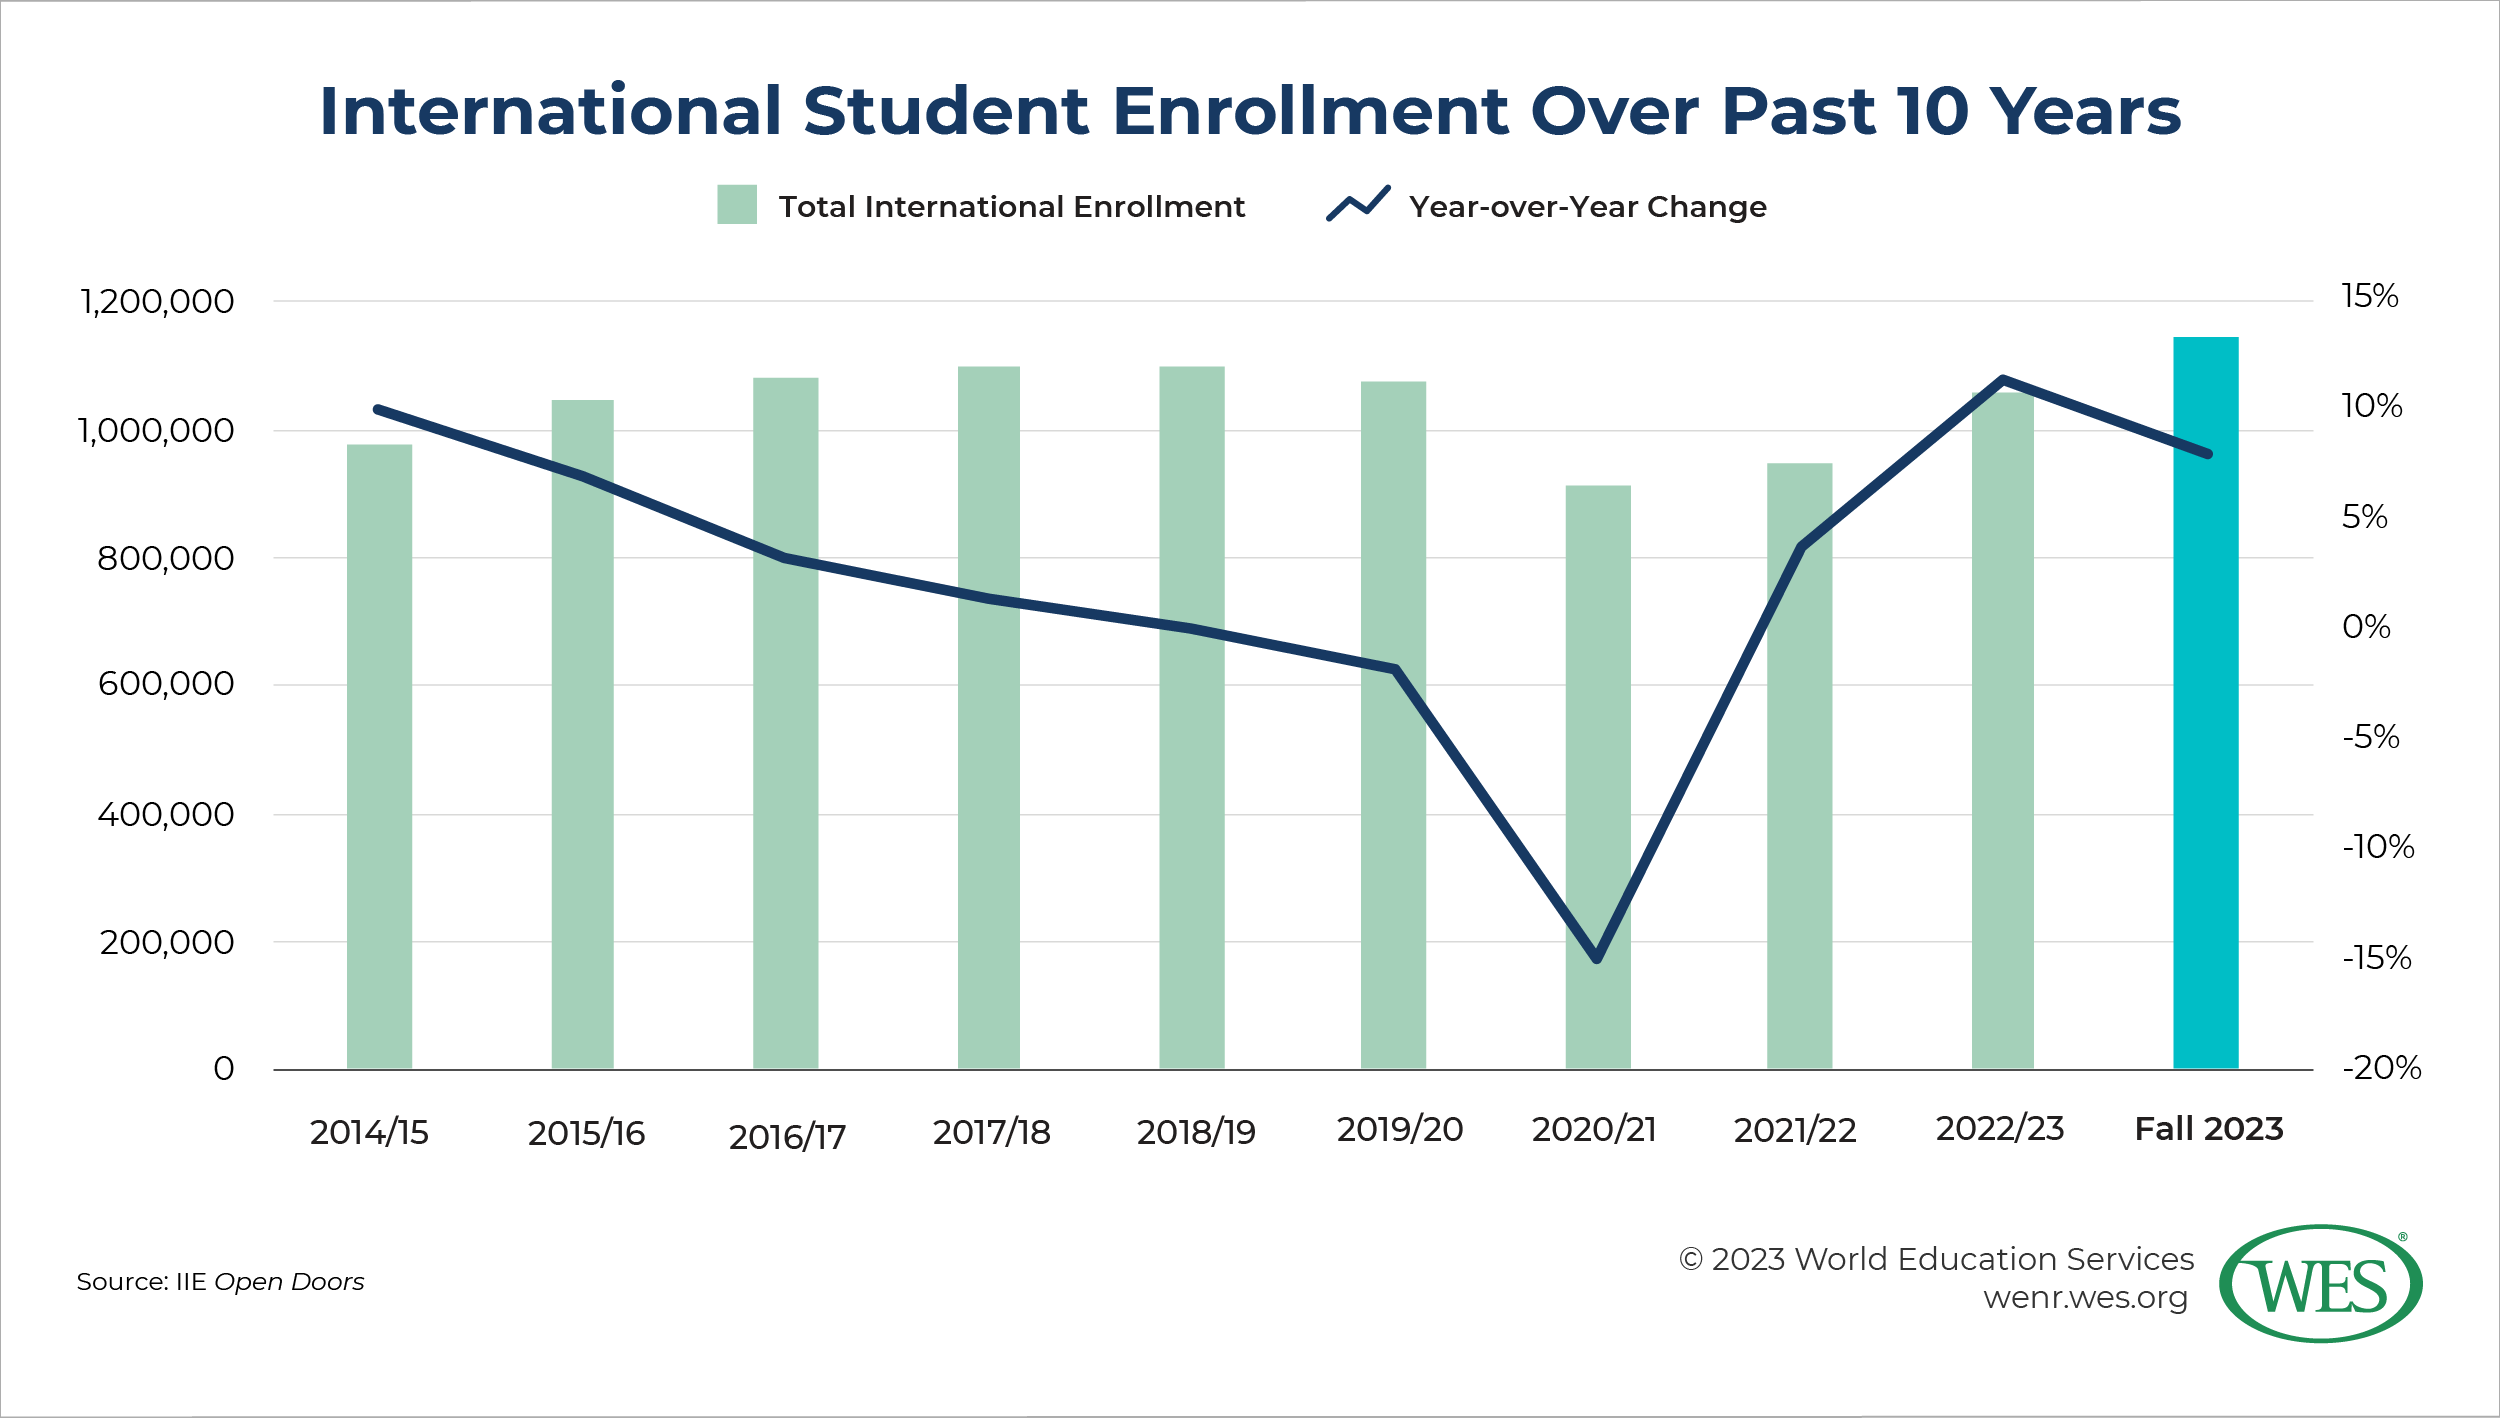
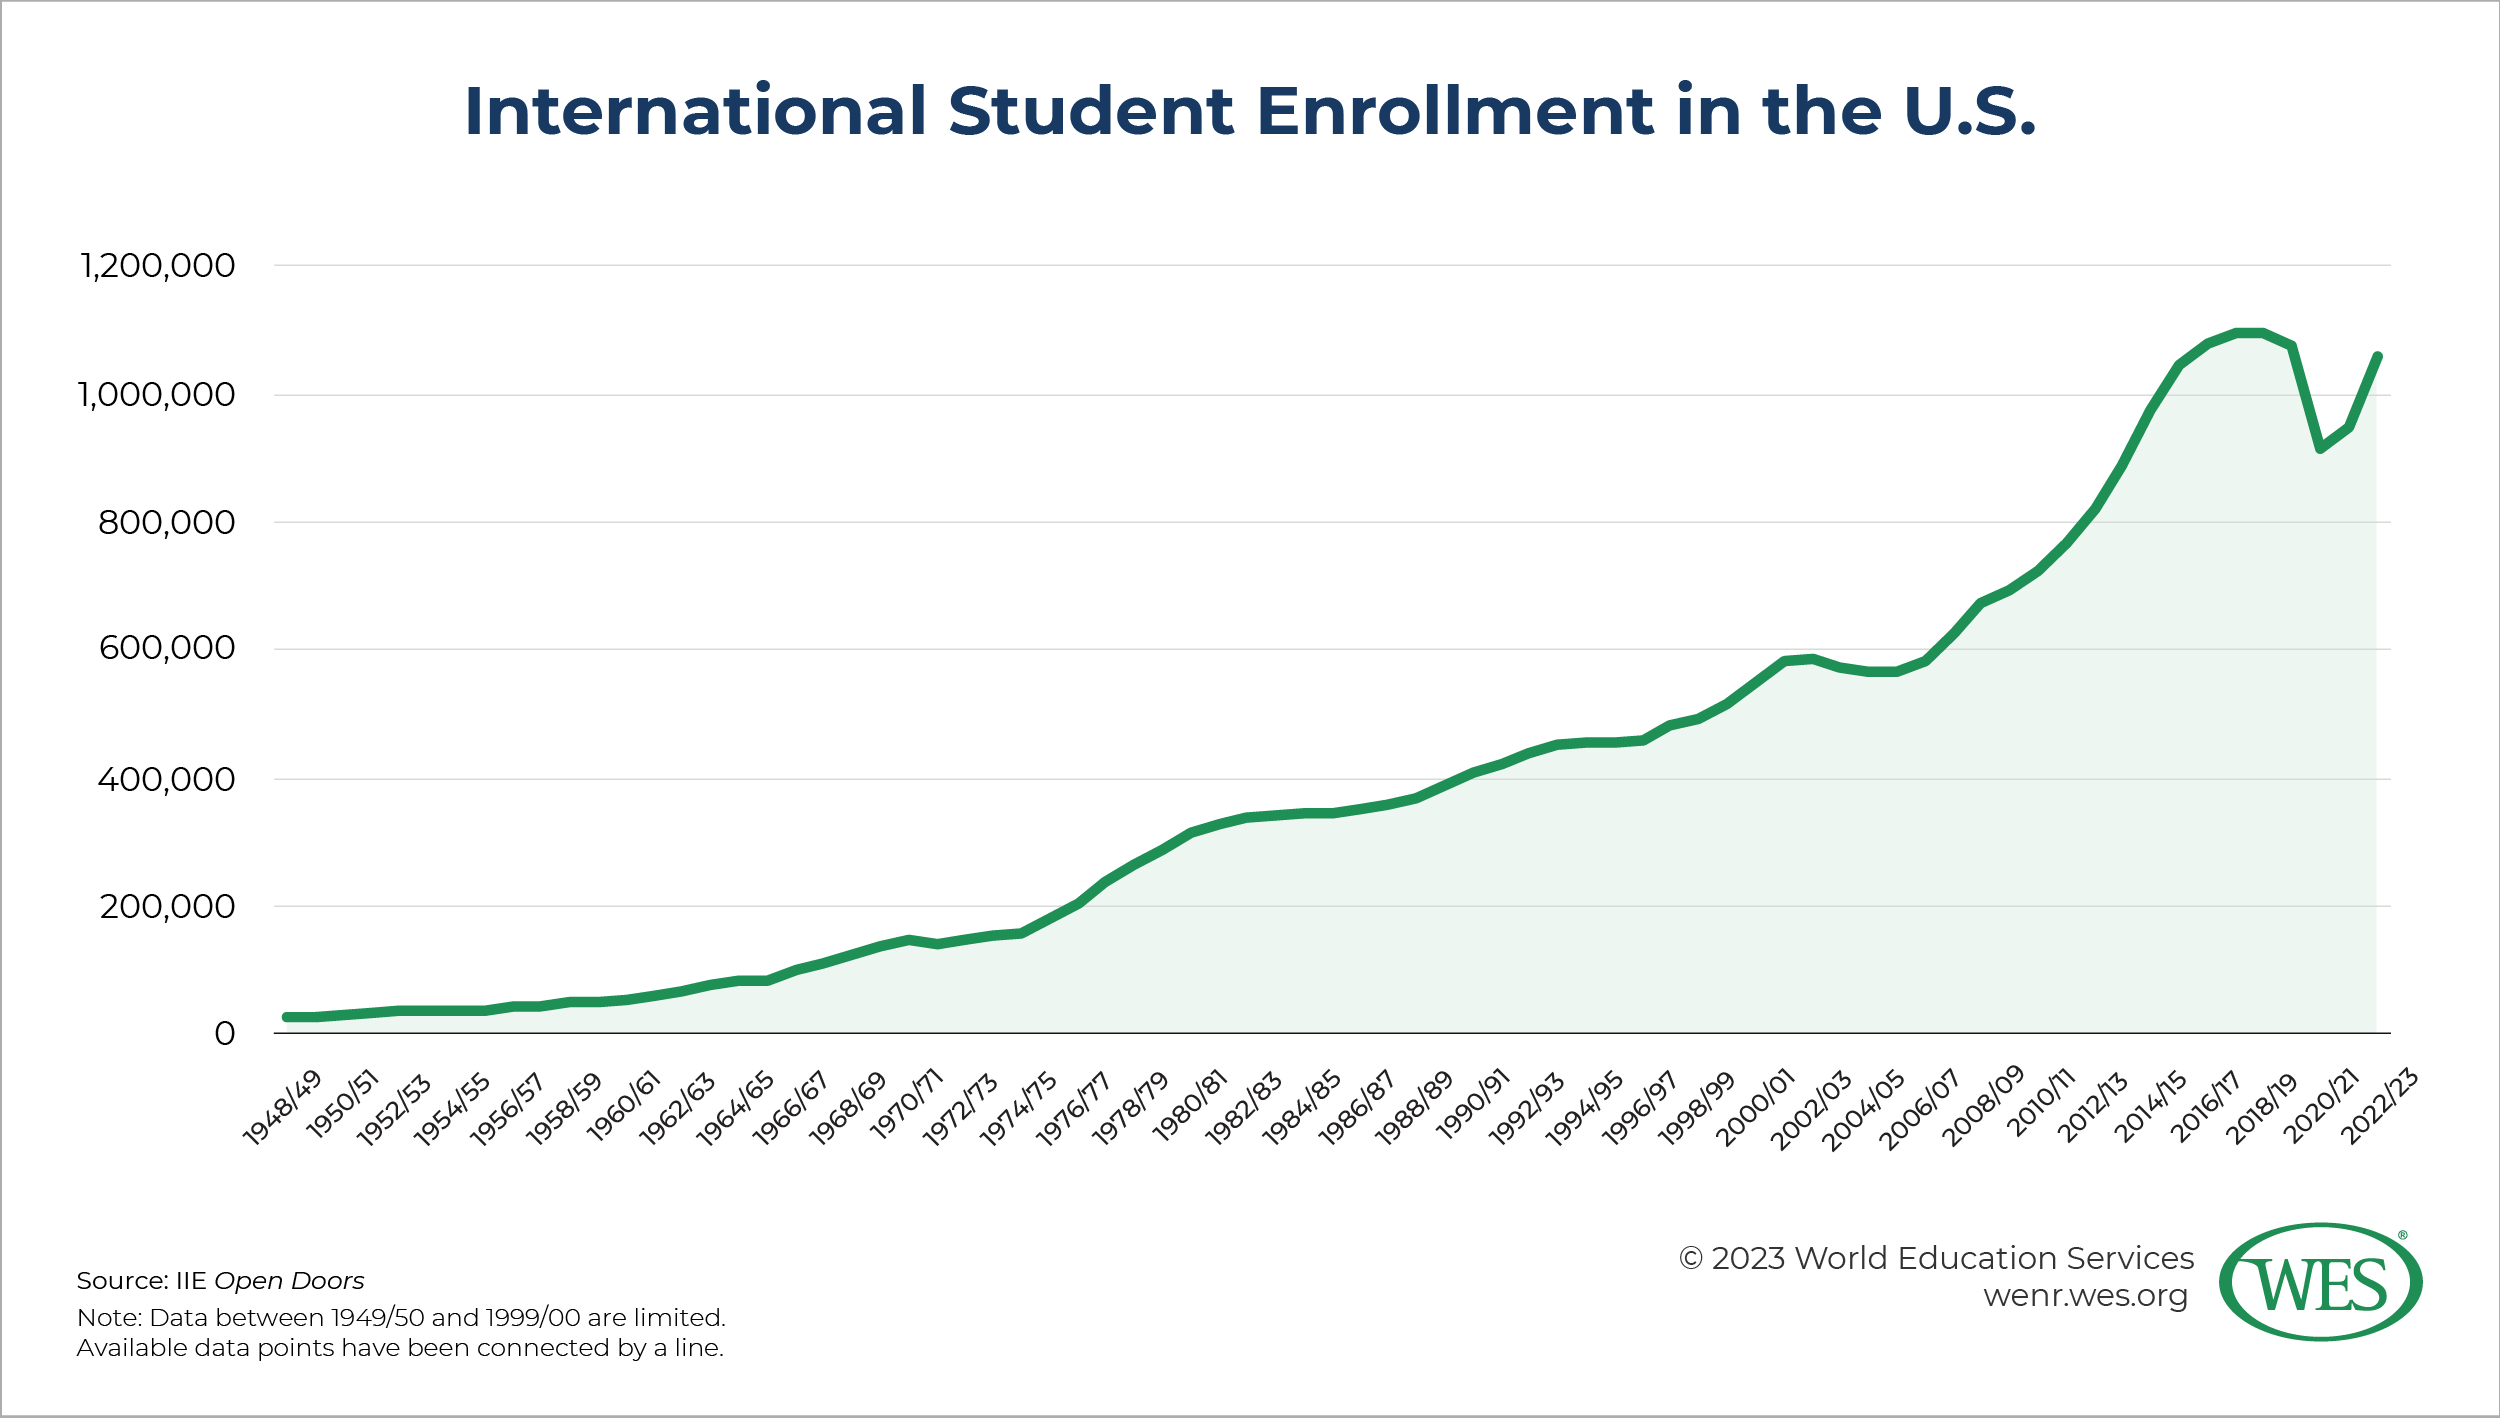
This year’s Open Doors Report on International Educational Exchange [2], Open Doors for short,1 [3] released by the Institute of International Education [4] (IIE) has very good news for higher education in the United States: International student enrollment continues to recover since its record drop during the COVID-19 pandemic in 2020. In fact, in the 2022/23 academic year, international student enrollment once again rose to over one million: 1,057,188.2 [5] This represents almost 12 percent growth from the previous year.
Likewise, the companion Fall 2023 Snapshot on International Student Enrollment [6] (Fall 2023 Snapshot, for short), which is based on a survey of institutions about the current fall enrollment cycle, found that enrollment grew 8 percent this fall.
 [7]
[7]
The U.S. on the rebound
The return to over one million international students is a very positive sign when it comes to the health of international enrollment in the U.S. The 2022/23 academic year is only the second full school year since the dramatic drop of 15 percent due to the pandemic in 2020/21. These subsequent years have shown an almost full rebound, thanks to vaccination efforts in early 2021 and the gradual easing of restrictions on travel, in-person classes, and even vaccination requirements. While COVID-19 is unfortunately here to stay, and the virus continues to cause disruptions from time to time, the pandemic is increasingly fading into the past. The World Health Organization (WHO) declared [8] the worldwide COVID-19 public health emergency officially over in May 2023.
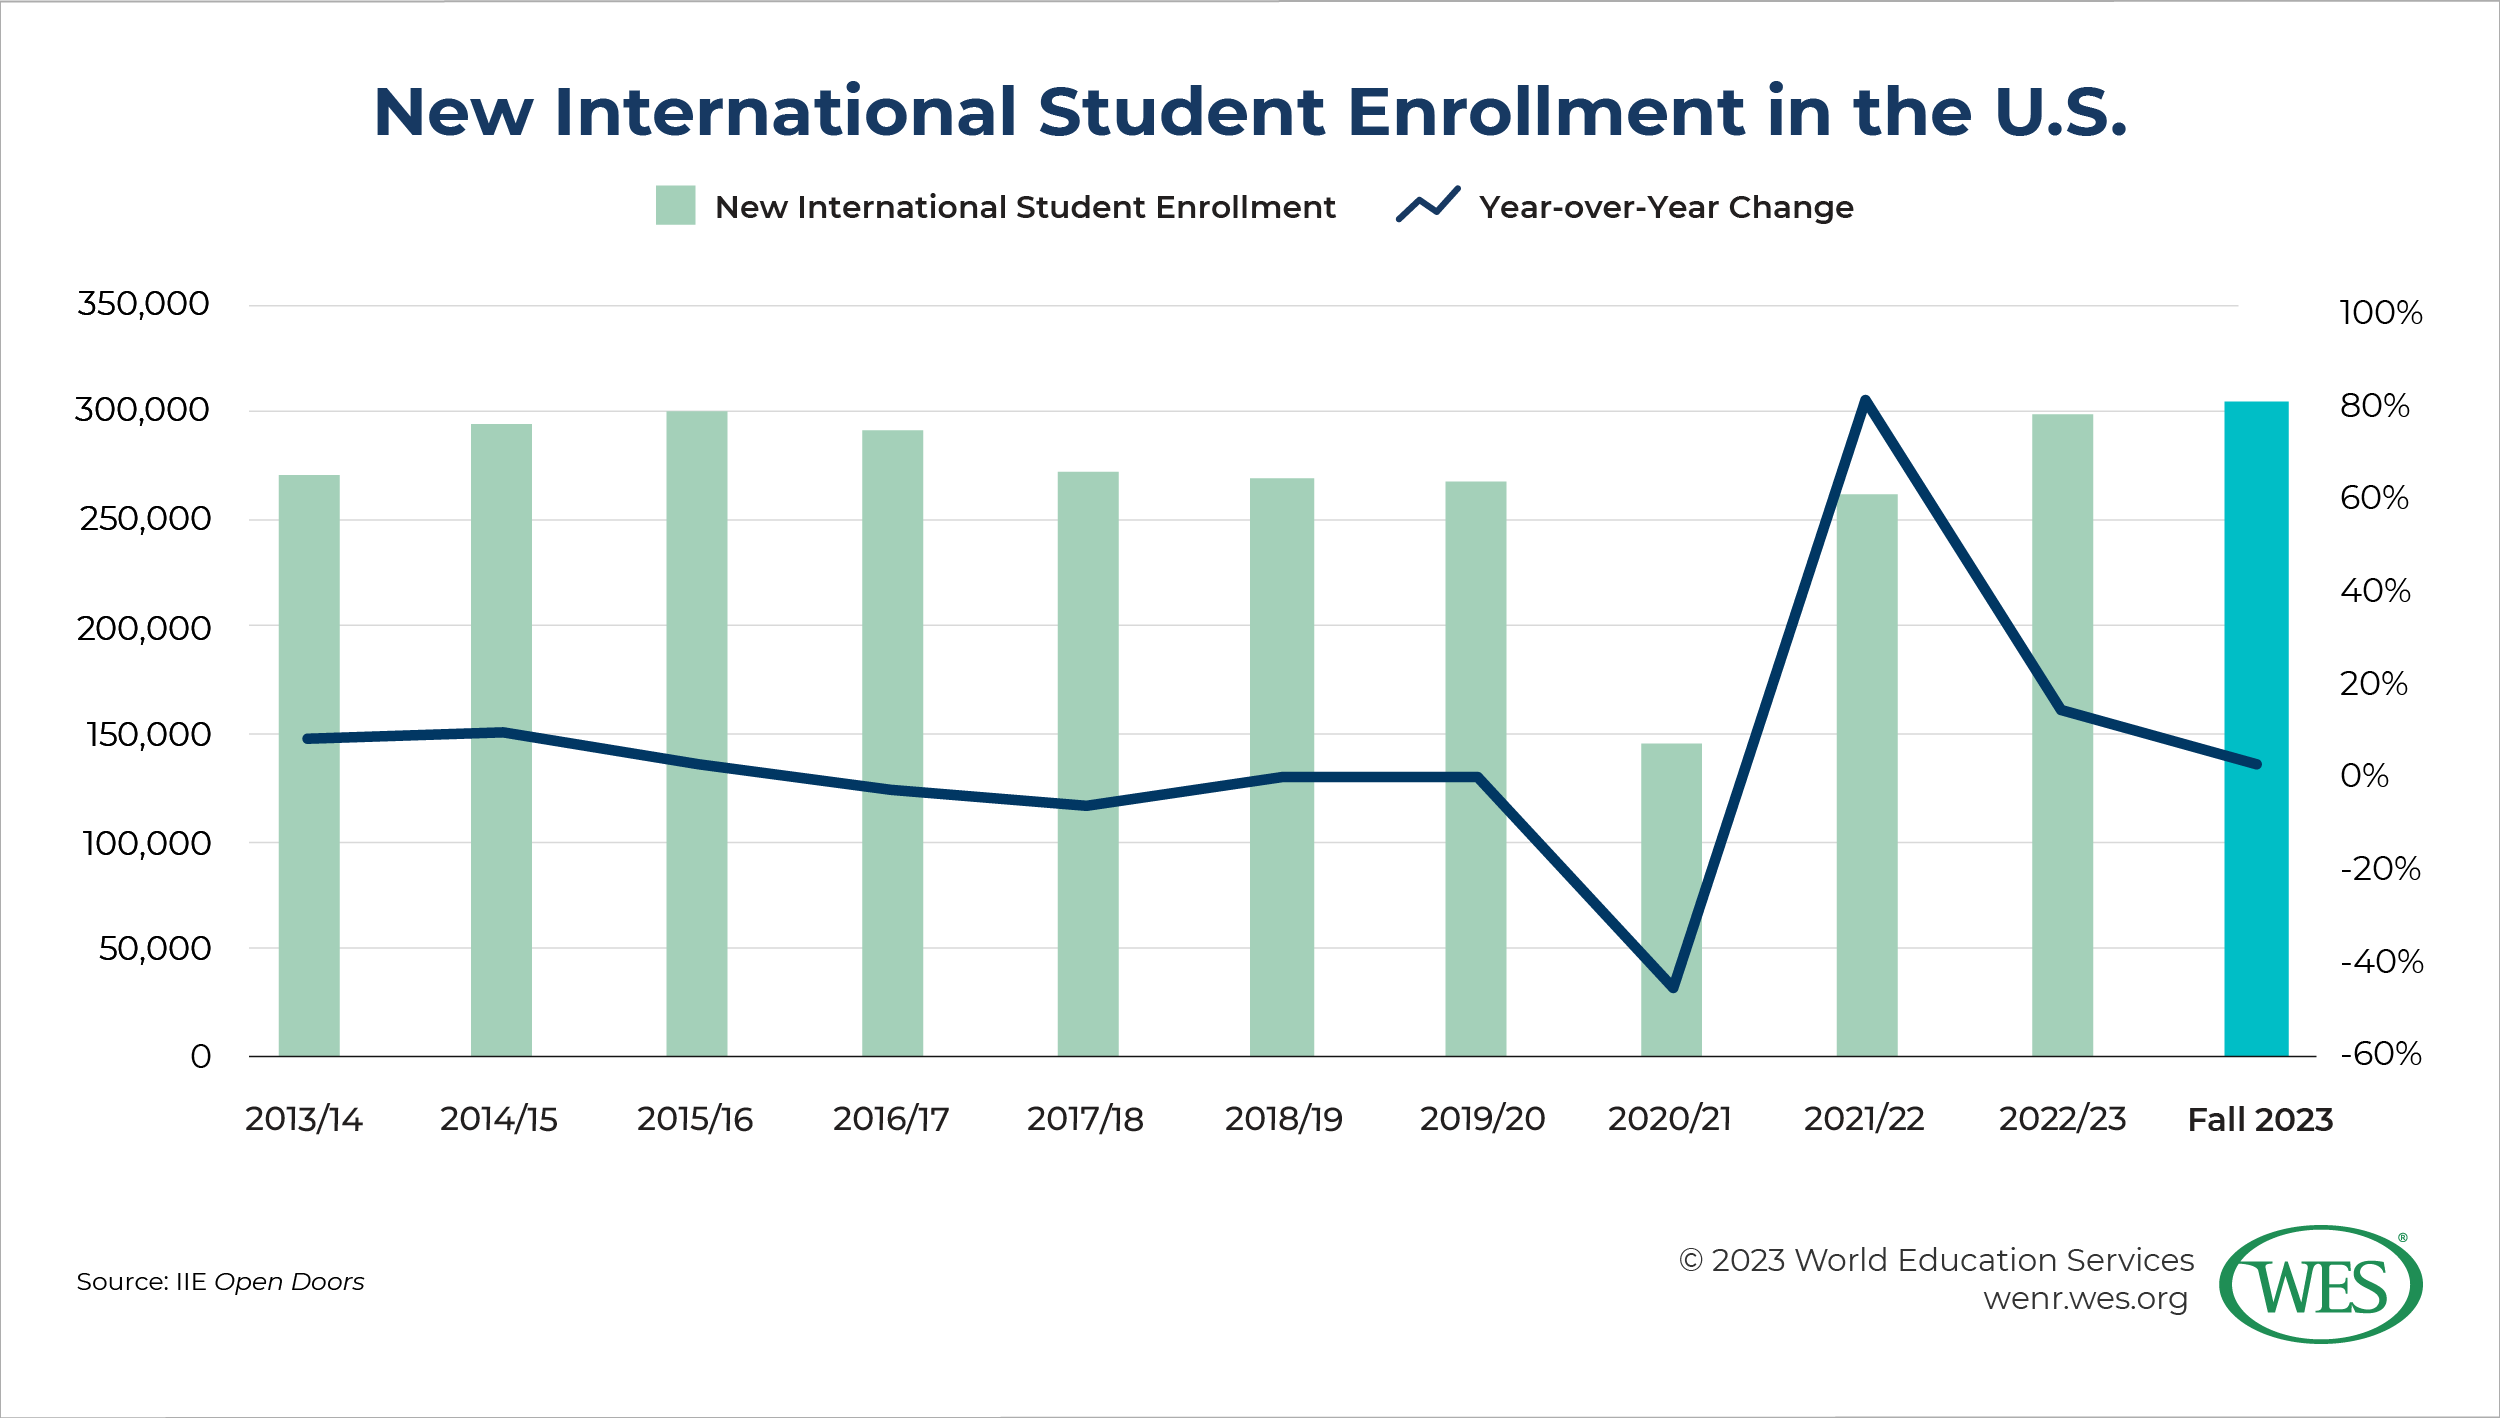
The 2022/23 total has not quite reached the peak of international enrollment in 2018/19 of 1,095,299, but current indications suggest it may soon reach or even surpass that level. If the Fall 2023 Snapshot is accurate within a small margin of error, there would be over 1.1 million international students in 2023/24, making that year a record. We will not know for sure until Open Doors 2024 is released next fall. But previous Fall Snapshots have been good indicators of the general direction of growth (or decline) that is later tallied by Open Doors. For example, the Fall 2022 Snapshot showed growth in new international student enrollment at 9 percent, and Open Doors this year showed 14 percent growth.
This is all good news. International student enrollment in the U.S. has grown quite consistently with some obvious peaks and valleys, such as a slight decline in the immediate years after the September 11, 2001, terrorist attacks. But even before the onset of COVID-19 and the dramatic decline of 2020/21, international enrollment in the U.S. had leveled off and started to decline slightly in 2019/20. Much of this leveling off and decline has been attributed to the policies and rhetoric of the Trump administration [9], though not exclusively. Now, growth appears to be back, at least for the time being.
 [10]
[10]
However, there are indications that this growth might be about to slow or even level off. This year’s Fall Snapshot notes only a 2 percent growth in new international student enrollment this fall. This compares with actual new student growth, per Open Doors, of 80 percent in 2021/22 (largely from pent-up demand after pandemic restrictions) and 14 percent in 2022/23. It’s hard to know the exact trajectory of enrollment at this point, particularly given the upcoming 2024 U.S. presidential election and volatility around the world, ranging from Russia’s war in Ukraine to the current Israel-Hamas war (which threatens to expand into regional turmoil), as well as ongoing tensions between the U.S. and China.
But for now, things look good for the U.S. Another positive sign is that the U.S. actually gained a small amount of market share in 2023. According to researchers at IIE in this year’s Open Doors briefing [11], the U.S. held 17 percent of the market share of globally mobile students.3 [12] This compares with 15 percent in 2022, according to IIE’s Project Atlas [13]. To provide some context, this comes after more than two decades of the U.S. steadily losing market share. For example [14], the U.S. hosted 28 percent of all globally mobile students in 2000, which shrank to 20 percent in 2020. This slight gain may be a blip, but it further signals the strong recovery that the U.S. has made, even relative to other top destinations.
 [15]
[15]
It’s all about graduate students
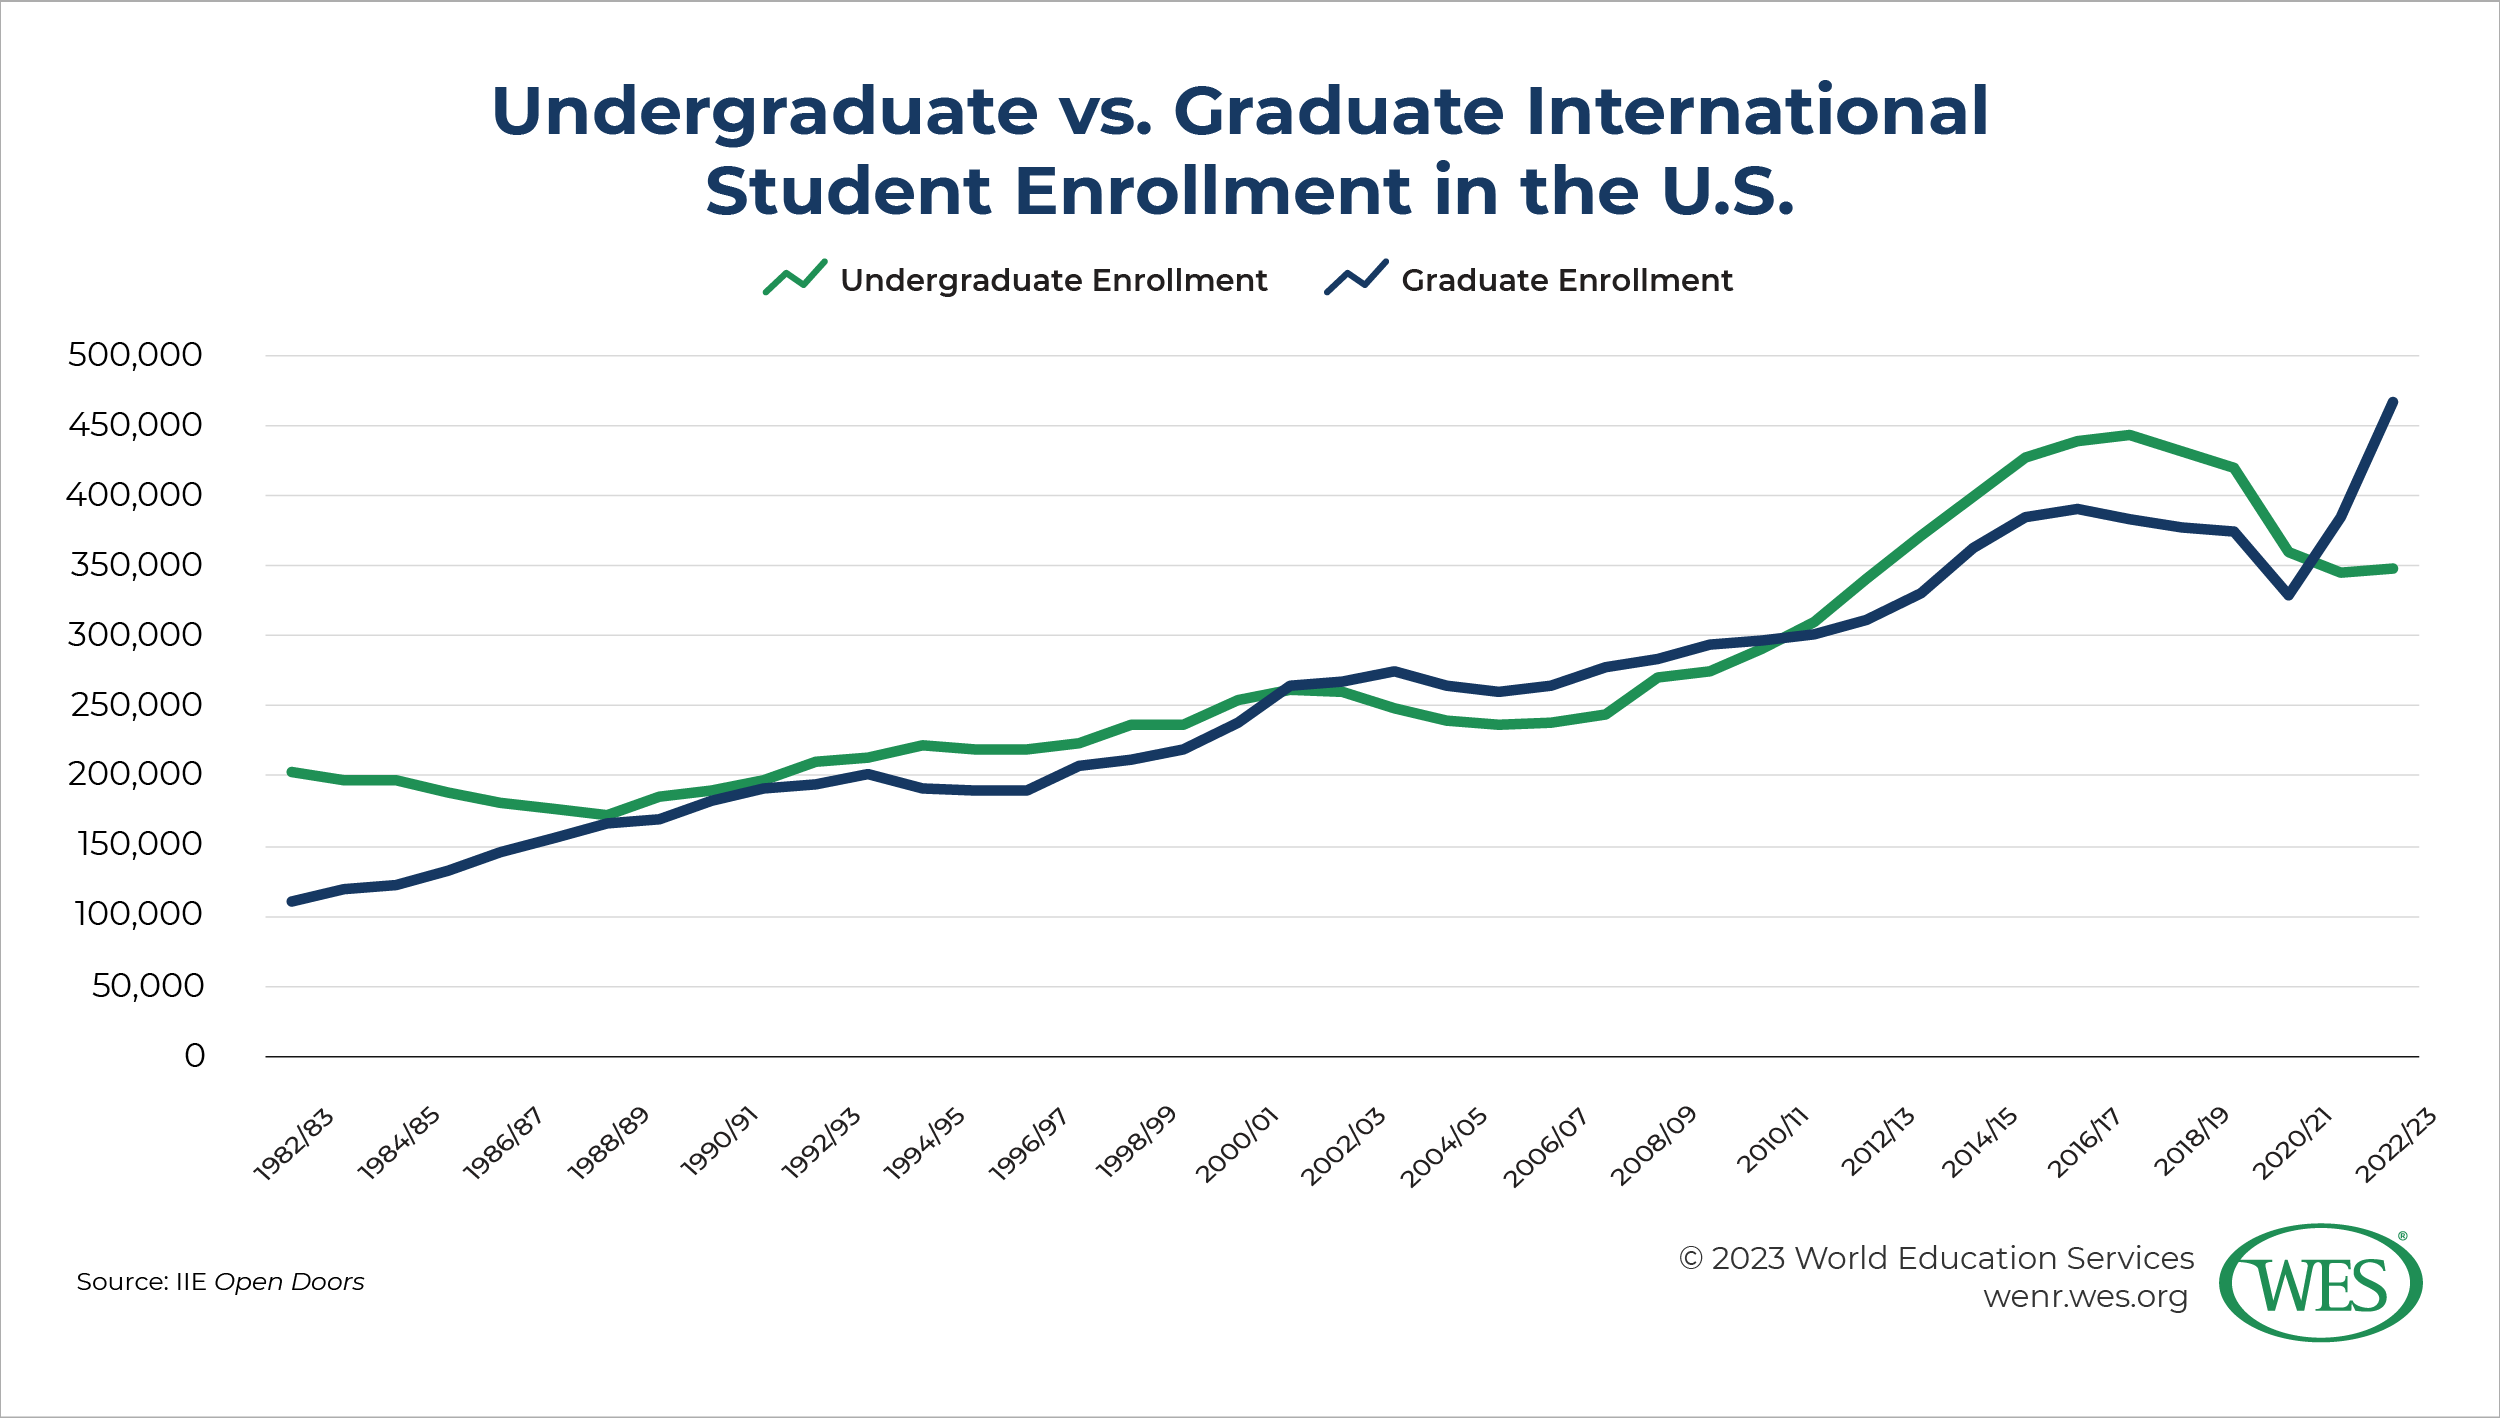
Graduate students now firmly dominate, approaching nearly half of all international student enrollment in the U.S., at 44 percent. Growth in graduate enrollment also significantly eclipsed that of undergraduate enrollment. In 2022/23, the number of international graduate students grew more than 21 percent, compared with less than 1 percent for undergraduates. And while bachelor’s degree students still represented the largest number of students at a specific degree level, the largest growth came from master’s degree students, whose numbers grew 37 percent from the previous year.
Historically, undergraduate and graduate enrollment levels have switched back and forth in terms of dominance in enrollment size. From 2011/12 to 2020/21, undergraduate enrollment was larger. These swings are often explained, at least in part, by the composition of countries of origin among the international student population. The recent decade of undergraduate dominance was driven mostly by students from East Asia, particularly China, South Korea, and Japan. But China’s enrollment began to cool even before the pandemic and, interestingly, more graduate students have come from China than undergraduate students since 2021/22. This combined with a major rise in South Asian, particularly Indian, international students, who are much more likely to study at the graduate level.
Indeed, Chinese undergraduate enrollment fell more than 8 percent in 2022/23, while its graduate enrollment grew a modest 2 percent, enough to keep overall Chinese enrollment in the U.S. about even. The recent overall declines from China, particularly at the undergraduate level, are due to a variety of factors [16] that I discussed previously. The continued growth in Chinese graduate student numbers, however, may be in large part due to the economic slowdown in China. As The New York Times reports [17], many young Chinese adults have been encountering trouble entering China’s job market and have thus sought graduate degrees, both at home and abroad.
 [18]
[18]
One aftereffect of the increase in graduate students has been growth yet again in the number of students taking OPT (Optional Practical Training) [19], the post-graduation program that allows F-1 visa students to work in the U.S. for one to three years, depending on their field of study. (STEM students can work for longer.) The growth in master’s degree enrollment has largely facilitated OPT growth, as most such students only need one to two years of coursework to finish their degree.
The growing preeminence of India and South Asia
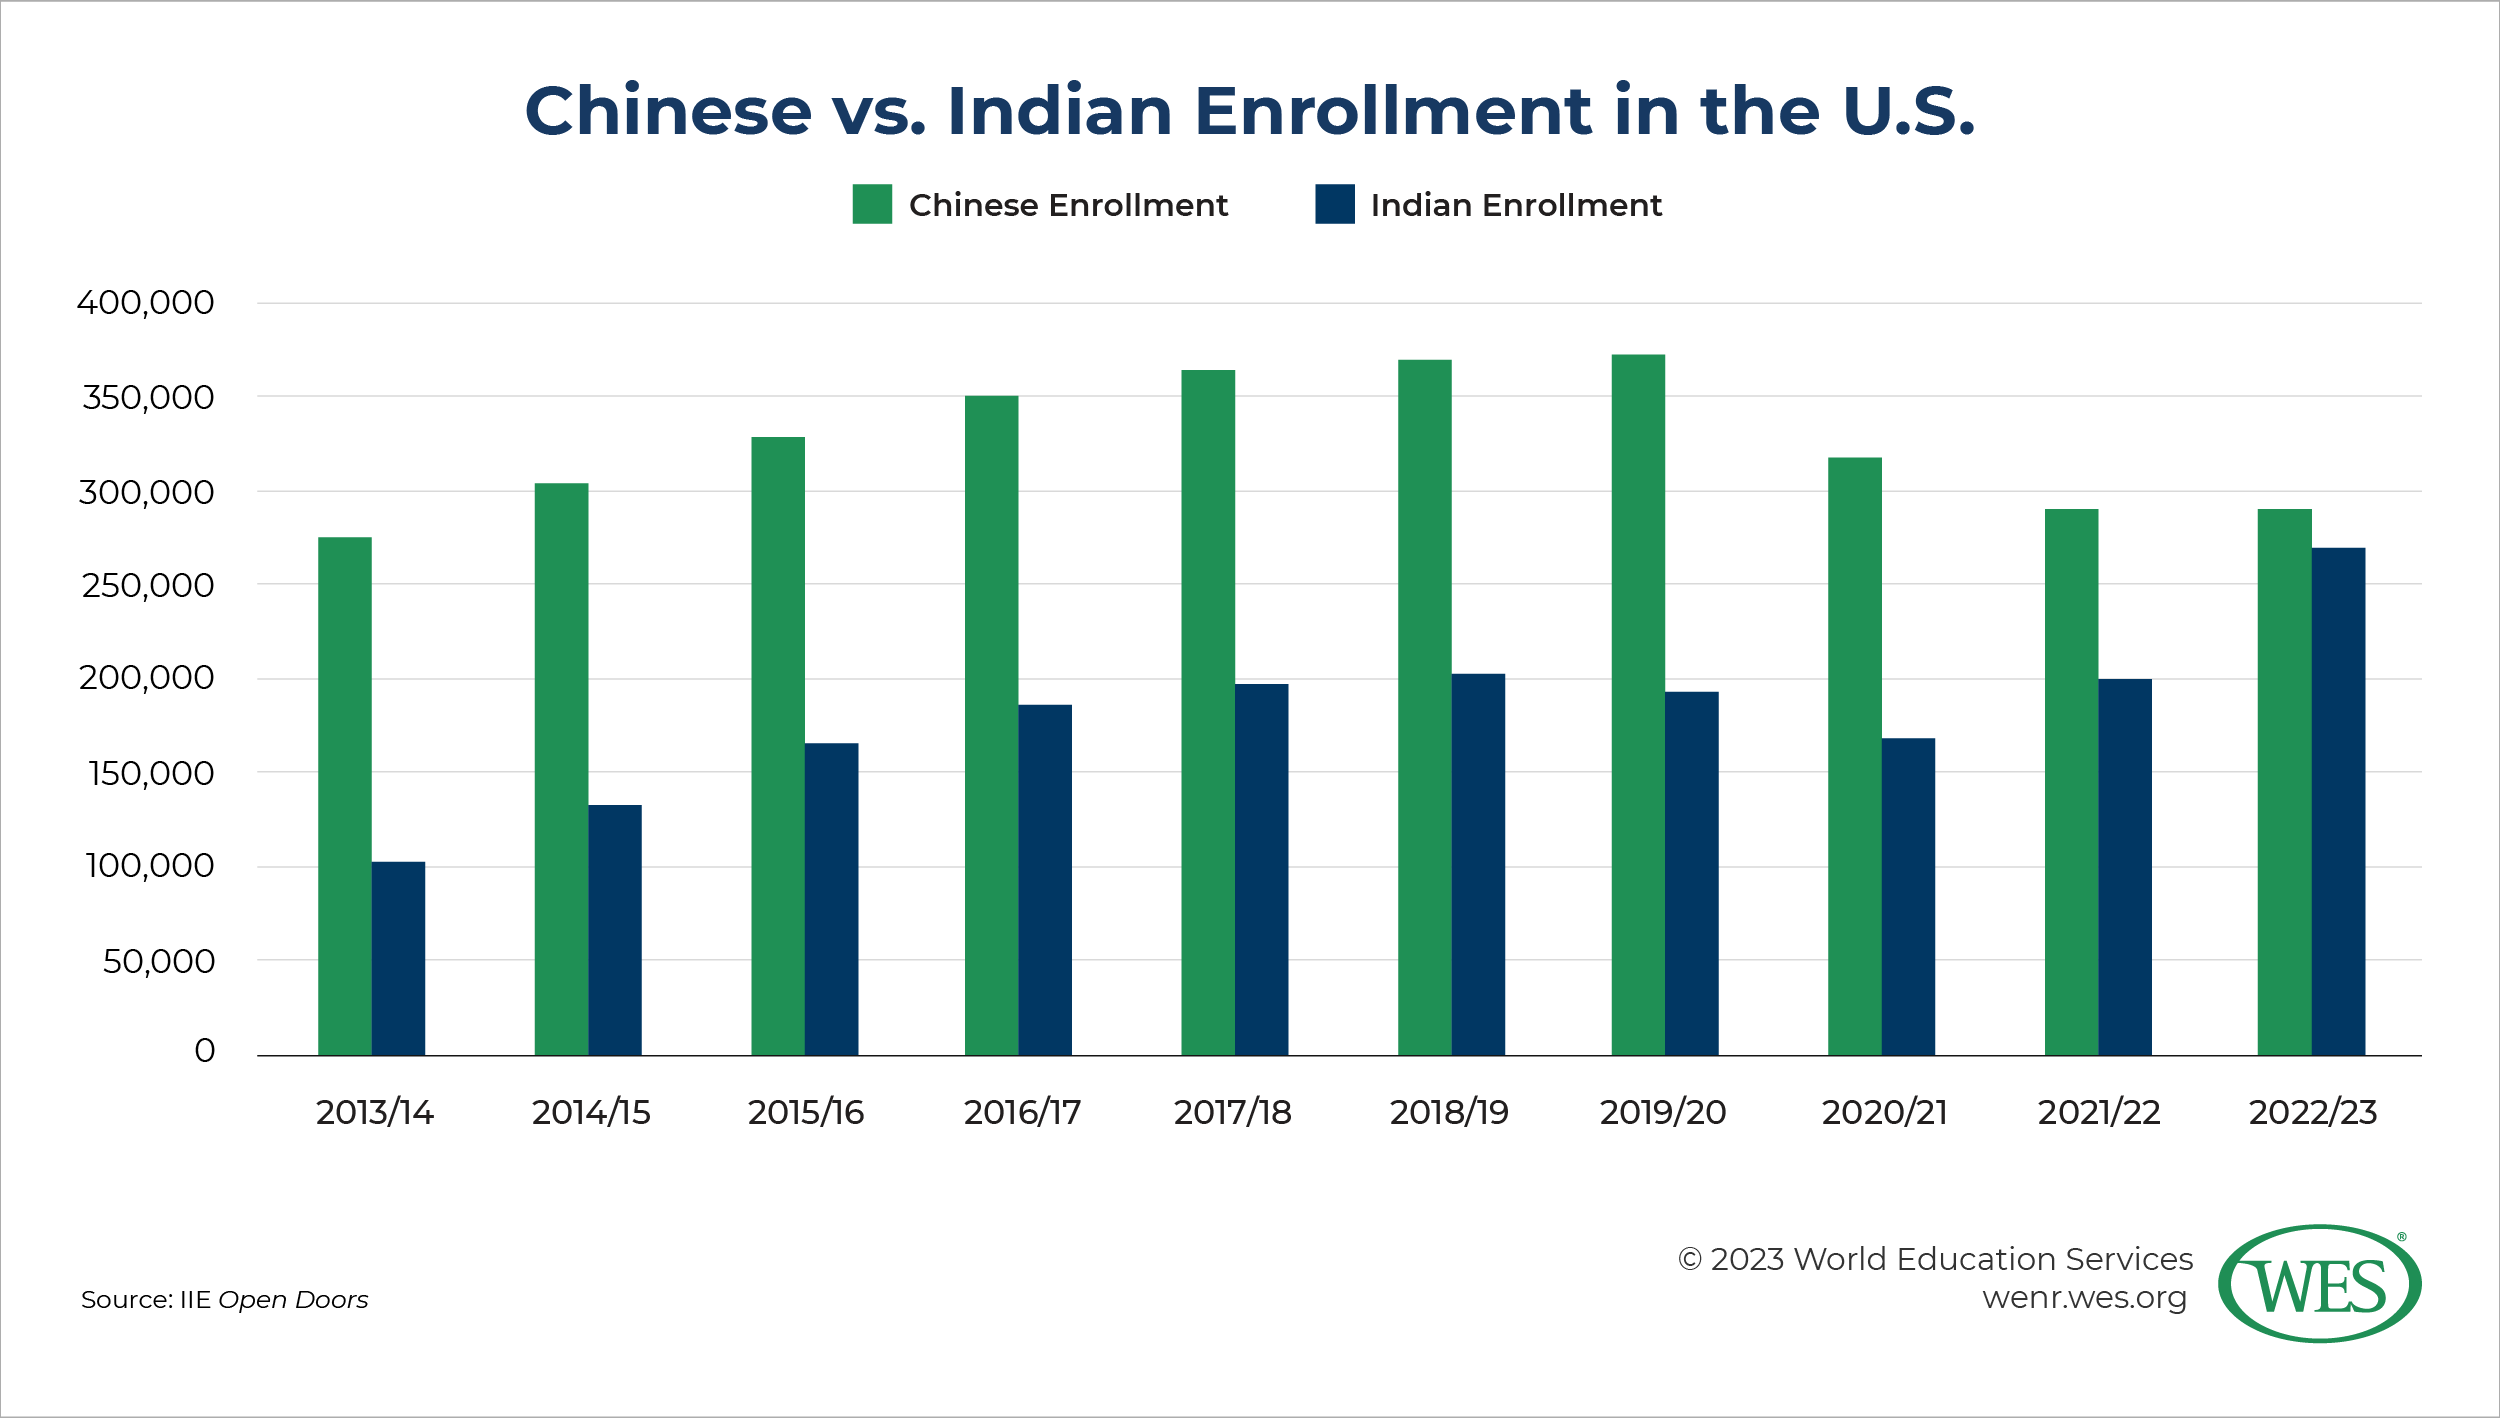
According to IIE during this year’s online briefing [11], Chinese enrollment in the U.S. remained “stable,” with just a slight 0.2 percent decline to 289,526 in 2022/23. This stability follows two years of sharp enrollment declines and, even before the pandemic, around a decade of slowing enrollment growth rates. For now, Chinese enrollment does appear to be leveling off. And regionally, East Asian countries collectively continue to send the largest percentage of students. Over one-third of international students were from East Asia, including the other major powerhouse senders South Korea (the longtime 3rd-largest sending country), Taiwan (6th), and Japan (9th). South Korea actually experienced the second year in a row of gains in U.S. enrollment after over a decade of steady decline.
But the real star this year is South Asia, and particularly India. Of all regions, South and Central Asia grew the most this year, at over 33 percent.4 [20] This is almost double the growth rate from the previous year and the biggest increase from this region in at least the last two decades and possibly ever. The region now accounts for nearly 30 percent of international students, the second highest of any region.
India, of course, is the biggest driver and remains the second-largest sender to the U.S., as it has since 2009/10 when China overtook it to become the top sender. In 2022/23, Indian growth increased a strong 35 percent to 268,923. It now accounts for a full one-quarter of all international students. At the current rate, India is also poised to overtake China and regain the top spot among sending countries. It is only a little more than 20,000 students behind China, and India overtook China this year in the number of graduate students in the U.S.
 [21]
[21]
Trends this fall continue to point to strong growth from India. Fifty-one percent of institutional respondents to the Fall 2023 Snapshot survey noted continued growth in Indian student numbers this fall, compared with 36 percent for Chinese students. Additionally, analysis of available data from SEVIS [22] (the Student and Exchange Visitor Information System) from October 2022 and October 2023 show a 40 percent increase in the number of Indian students this fall so far. By contrast, the share of Chinese students so far has grown a little under 5 percent this fall. And U.S. institutions have taken note: In the Fall 2023 Snapshot, India is the top priority for recruitment of graduate students (80 percent of responding institutions) and even undergraduates (70 percent), even though Indian international students study mostly at the graduate level.
The U.S. is far from the only country to record strong growth in Indian student enrollments in recent years. There continues to be robust outbound mobility of Indian students [23], concentrated heavily in the major Anglophone destinations. In Canada, which surpassed the U.S. to become the top host of Indian students in 2019, growth has been particularly strong. From 2022 to 2023, the number of Indian students in Canada grew almost 50 percent to 319,000, according to Canadian government data [24]. However, a major diplomatic row [25] between the two nations may slow down this growth at least temporarily. In June 2023, Prime Minister Justin Trudeau publicly accused Indian government agents of assassinating a prominent Sikh leader, who advocated Sikh separatism from India and lived in British Columbia as a Canadian citizen. It’s unclear the extent to which this might impact Indian student mobility to Canada, but it may temporarily redirect some Indian students elsewhere, including the U.S.
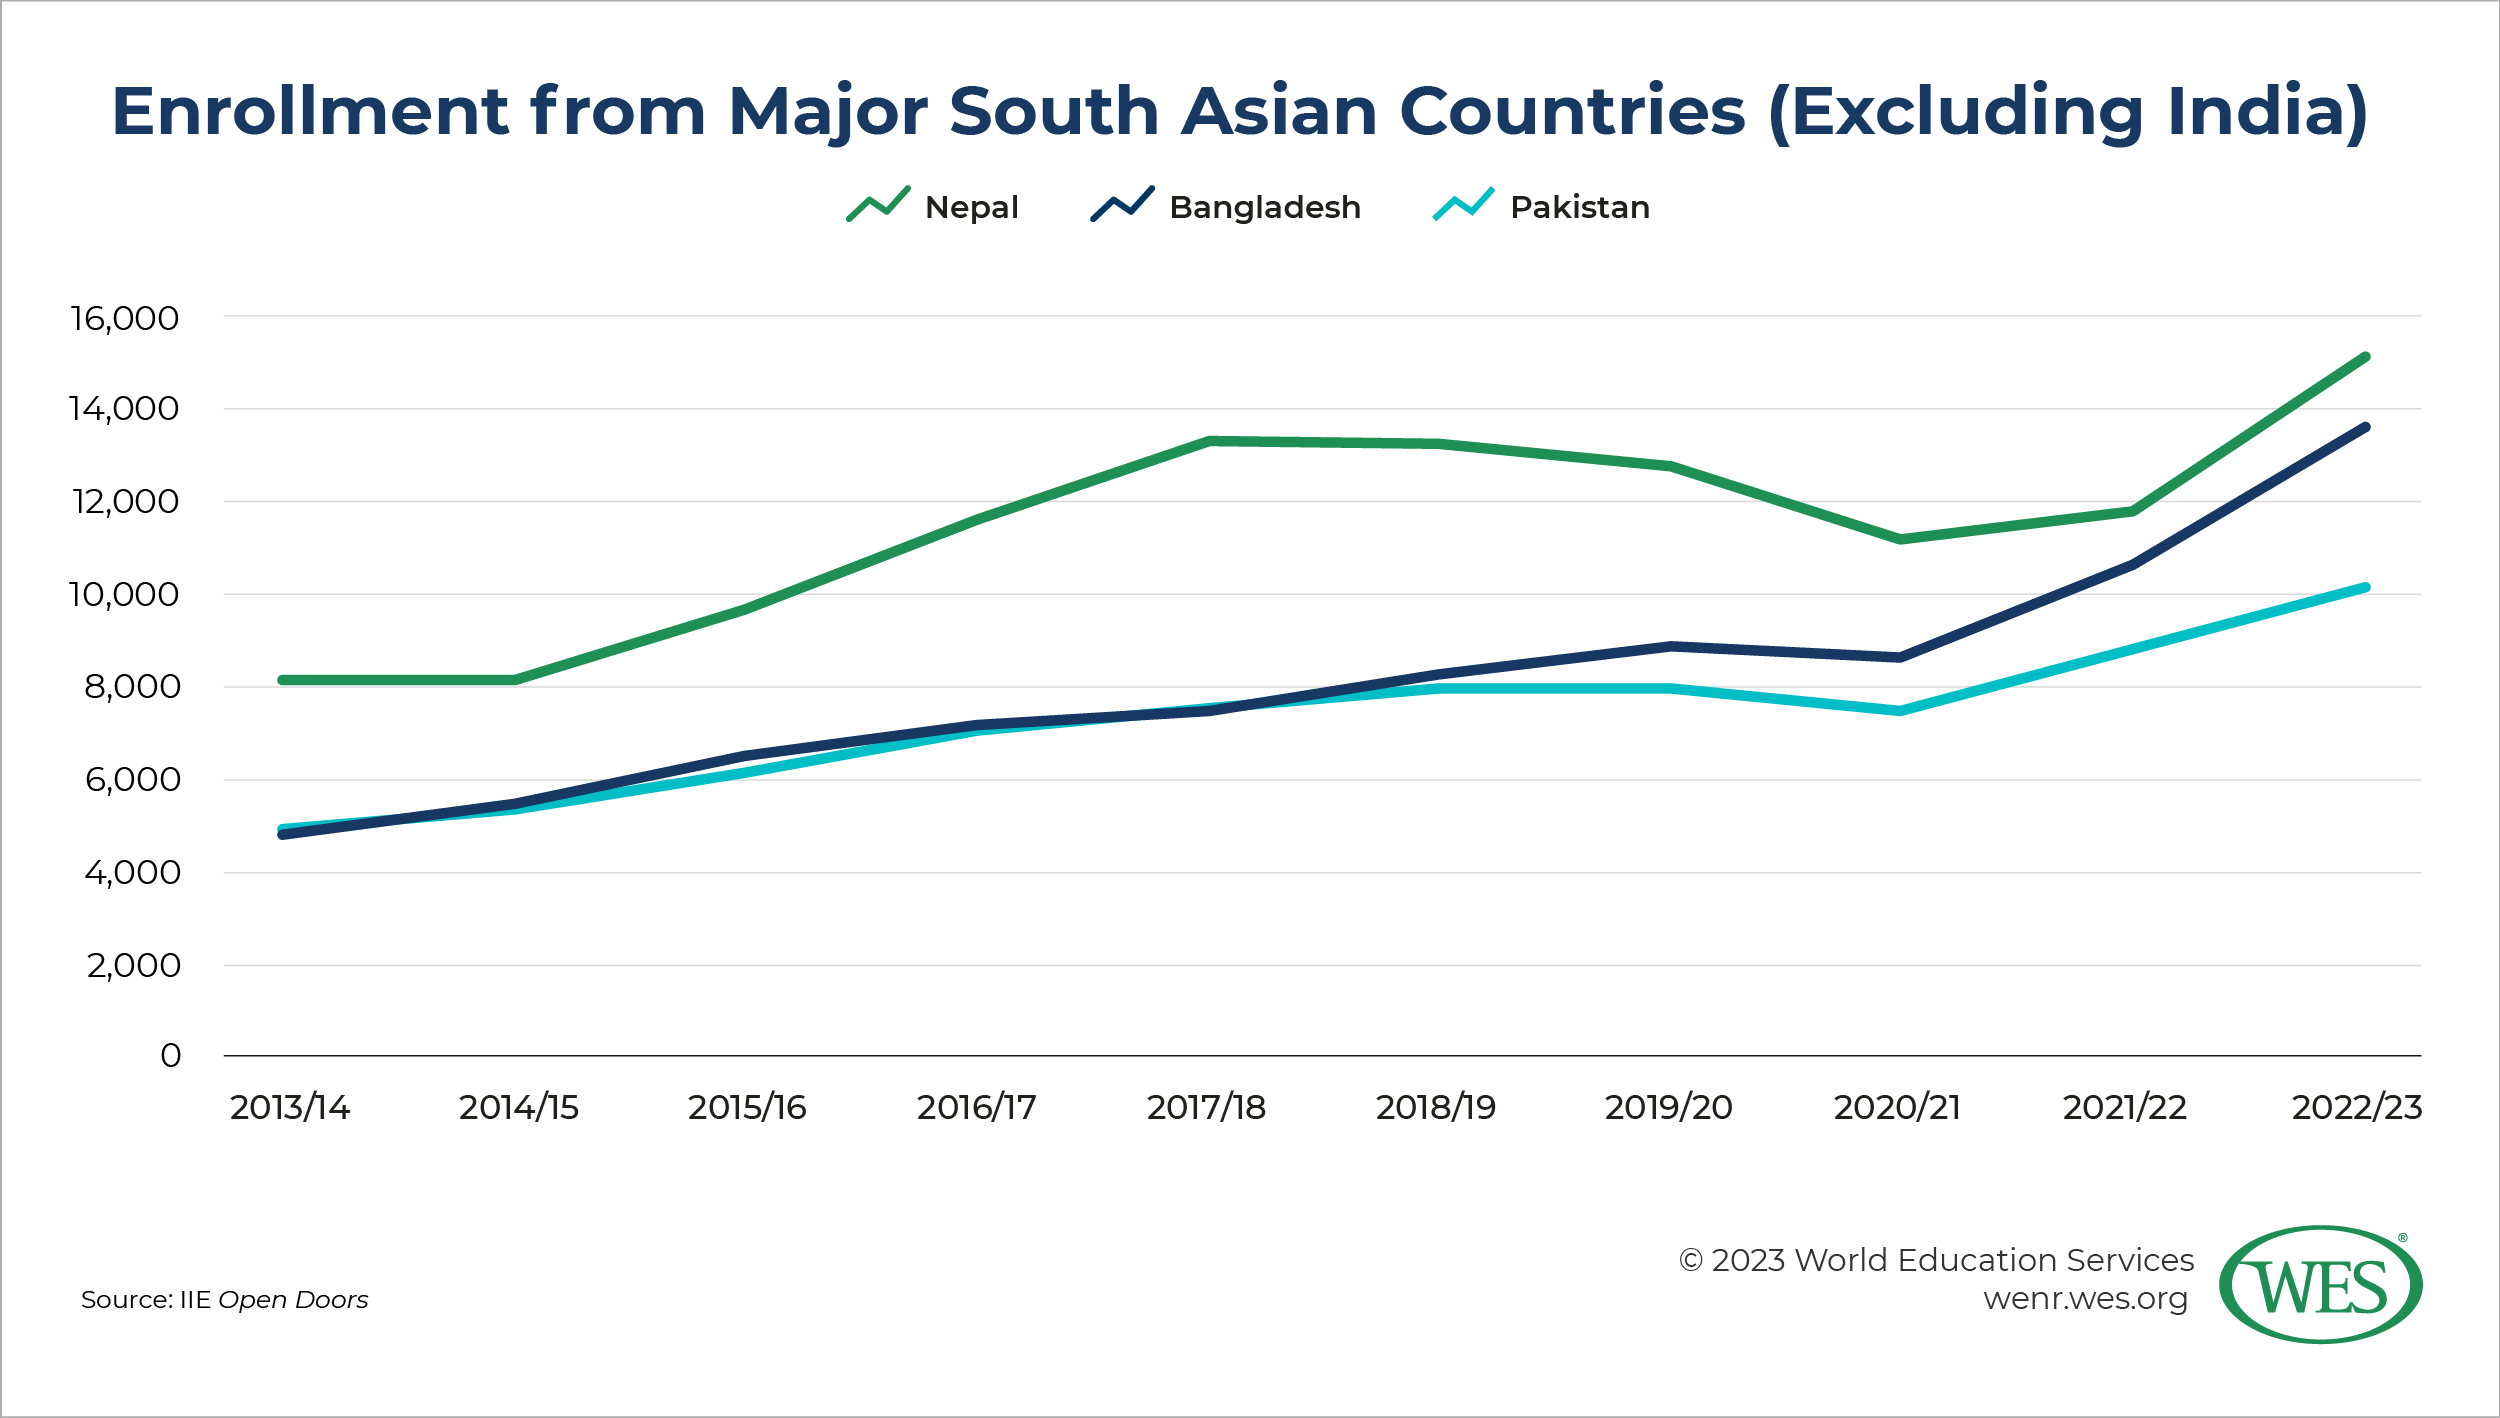
Several other major South Asian countries have also posted strong growth: Bangladesh (up 28 percent), Nepal (nearly 28 percent), and Pakistan (16 percent). With 15,090 students in the U.S., Nepal is the second-largest sender from South Asia and the 11th-largest overall. Bangladesh is the 13th-largest sender and Pakistan the 16th. Students from these countries, as well as India, have similar push factors: the desire for better quality higher education and access to more seats, particularly in top institutions and programs.5 [26] In particular, there is high demand for education abroad at the graduate level, especially among Indians and Bangladeshis, and particularly for engineering and computer and information technology programs. This has all happened as demand for higher education has increased. These issues of quality and capacity will not be quickly fixed. As a result, we will likely see continued growth from these countries for the foreseeable future.
 [27]
[27]
The rise of Africa
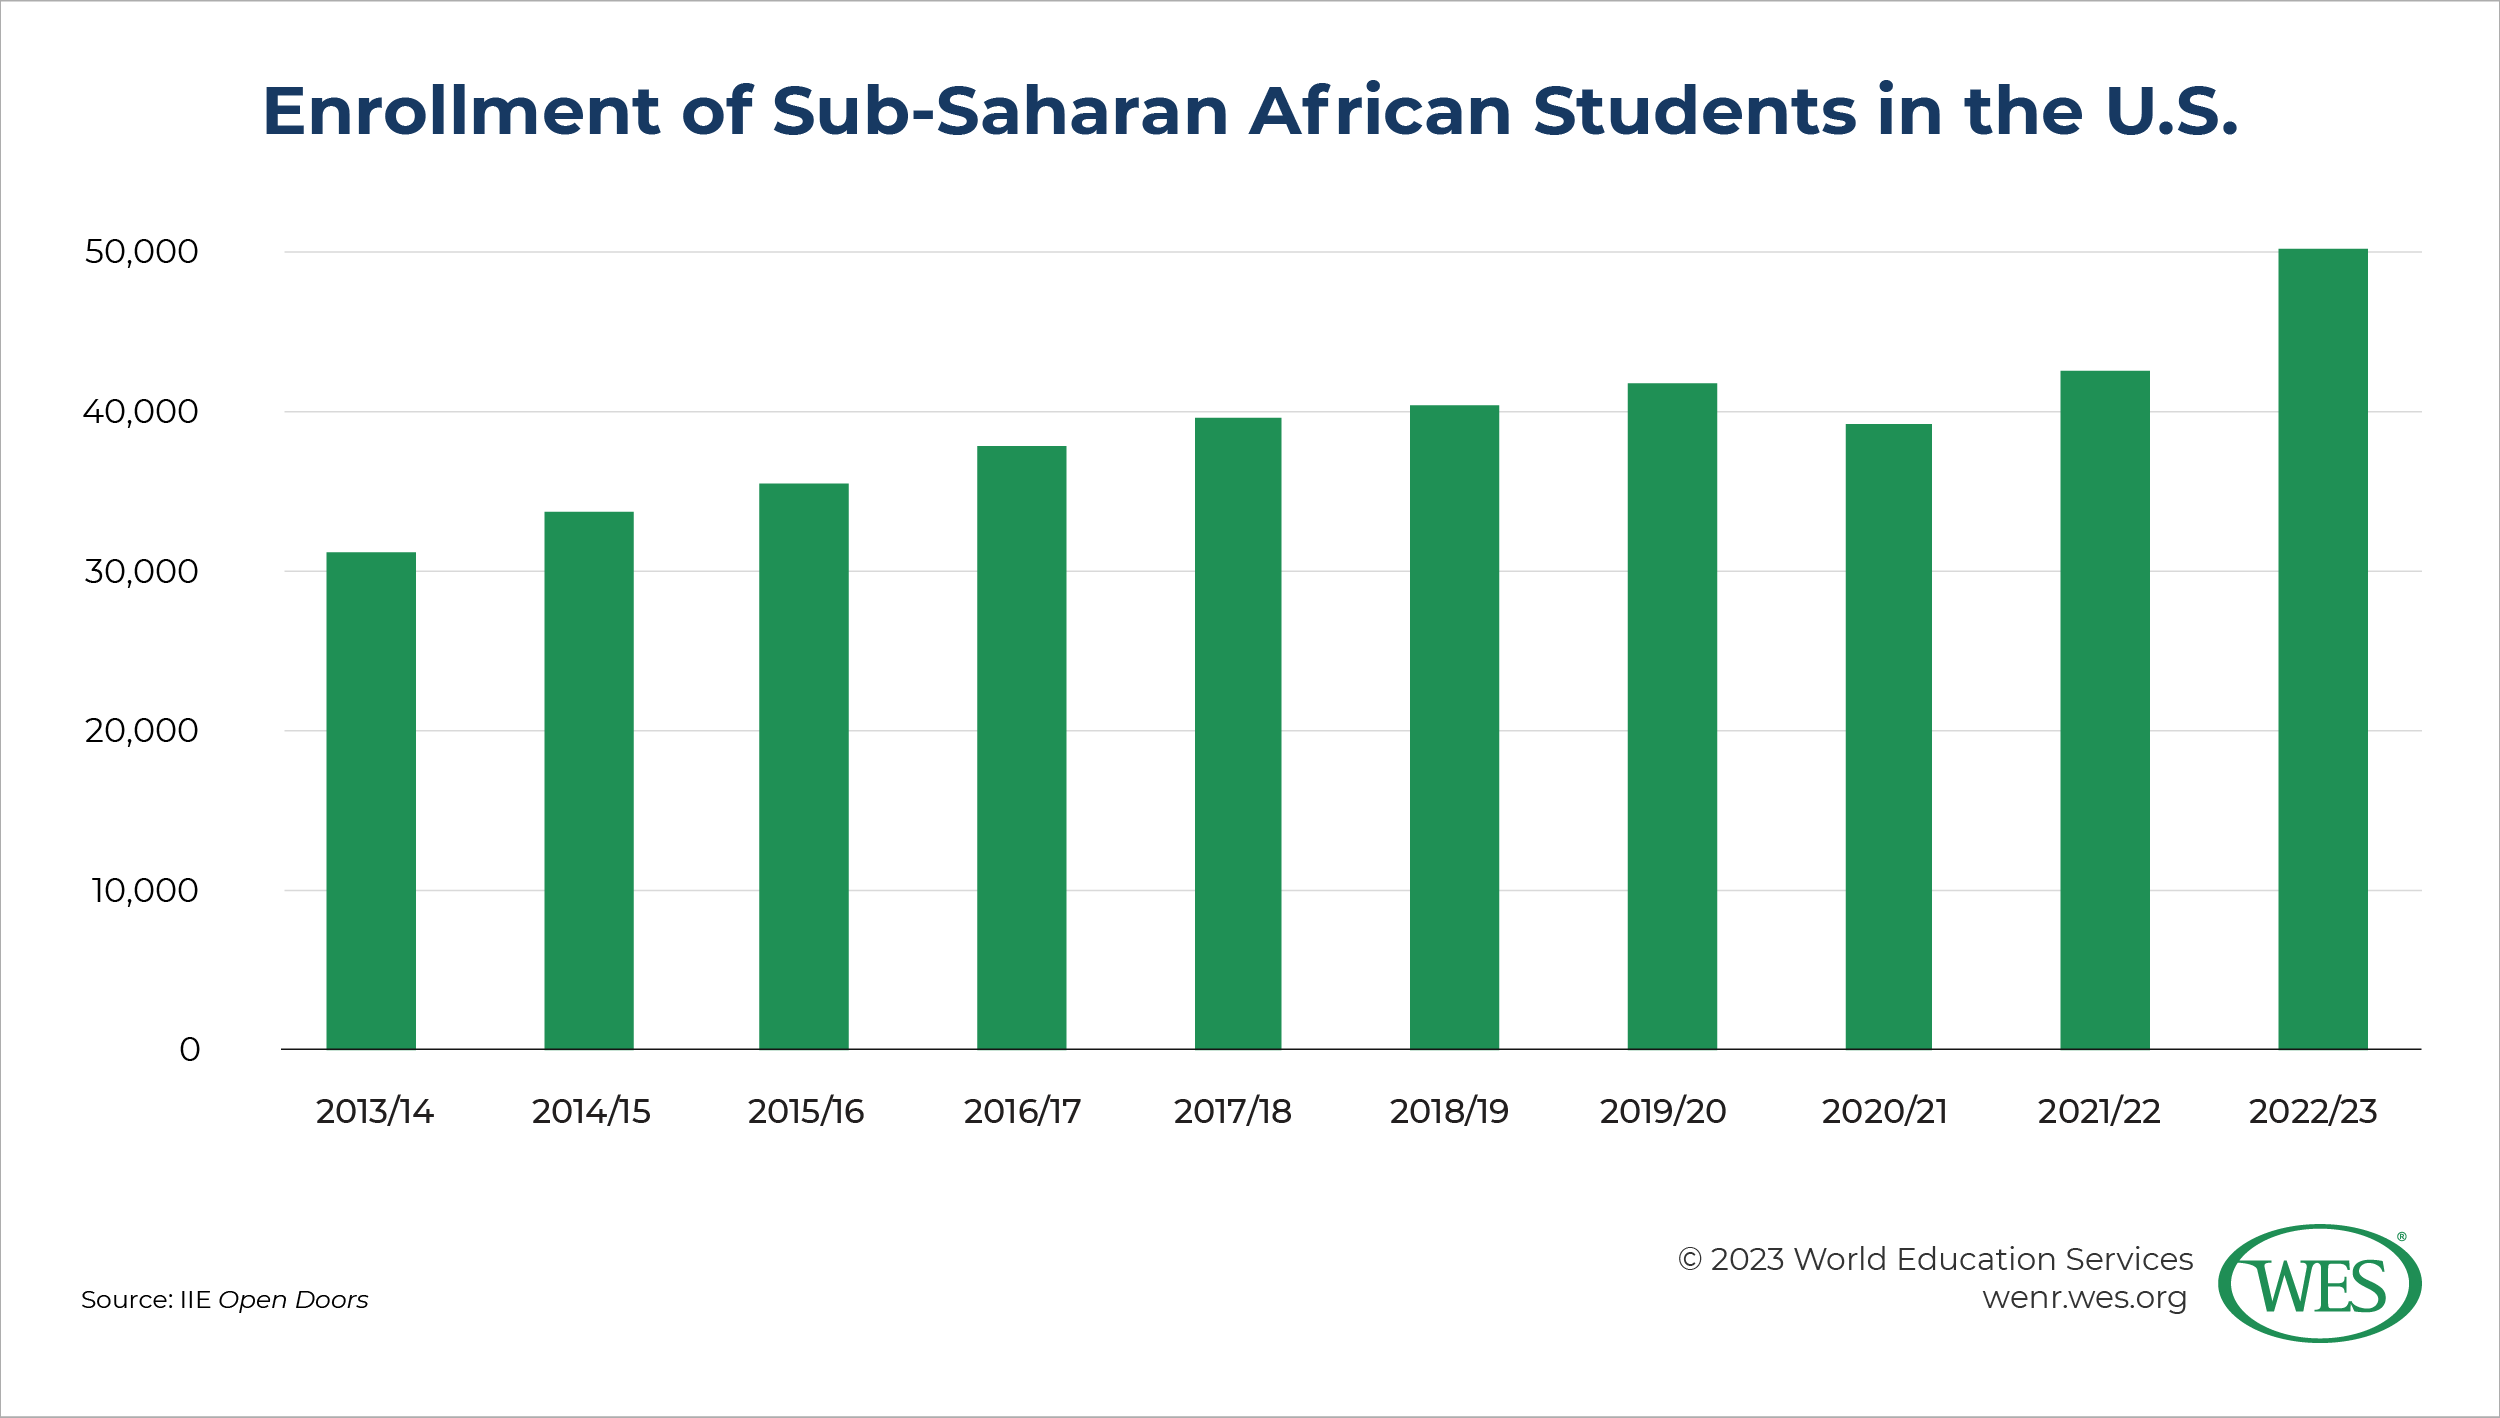
While Asia has dominated U.S. enrollment for years, and will continue to do so for quite some time, a lot of future enrollment will come from Africa. In 2022/23, sub-Saharan Africa experienced the second-highest enrollment growth rate of any major world region – 18 percent. By contrast, all of Asia (excluding the Middle East and Russia) grew by more than 13 percent. North Africa, traditionally grouped by IIE with the Middle East to form the MENA region, also grew by 7 percent, even as Middle Eastern enrollment declined by a few percentage points. And since 2012/13, sub-Saharan African enrollment grew by 64 percent, while Asian enrollment grew 42 percent.
Nigeria, the continent’s most populous nation, is now the 7th top country of origin, with 17,640 students in the U.S. in 2022/23, a 22 percent increase from the previous year. It first appeared on IIE’s list of the top 25 countries of origin in 2001/02 in 24th place, and it has gradually ascended the ranks ever since. It jumped from 10th place last year, passing Saudi Arabia, Brazil, and Mexico.
And until 2022/23, Nigeria was the only African country on the top 25 list within the last 10 years. Ghana has now also joined that list in 23rd place. That nation posted the second-highest annual growth rate in the top 25 after India, at nearly 32 percent.
With a total of 50,199 students, sub-Saharan Africa only accounts for less than 5 percent of total international enrollment in the U.S. But the continent is experiencing a demographic boom that is only projected to grow. Its current population [28] is about 1.4 billion, about 16 percent of the global population. By 2050, it is expected to reach 2.5 billion, roughly a quarter of the global population. By the end of the century, it is projected to be about 40 percent of the world’s population. Already the median age is 18.6, younger than most of the rest of the world. Additionally, Africa’s economies are growing [29], albeit unevenly. According to a United Nations policy brief [30], the middle class across the continent could grow to 42 percent of the population, about 1.1 billion people, by 2060.
 [31]
[31]
Like South Asian students, many African students seek education opportunities abroad because of issues of quality and capacity in the continent’s own higher education systems. The biggest drivers of Nigerian student mobility [32], for example, have long been cited as the perceived poor quality of its higher education sector and the lack of seats, as well as the growth of the middle class who can afford to send its young people abroad for education. Other factors around general stability, such as corruption and the violence in the north centered on the Boko Haram insurgency, may also play a role.
Interestingly, Ghana is also one of the top study destinations within sub-Saharan Africa [33]. However, most Ghanaian students in the U.S. are studying at the graduate level, suggesting much less capacity, and possibly perceived quality, at that level relative to the bachelor’s degree level in the country.
The combination of huge population and economic growth and the expansion of the middle class across the continent will almost certainly mean growing demand for higher education. As in South Asia, the quality and capacity issues of domestic higher education systems in African countries will not easily be fixed, at least not soon. As a result, more African students will look to study abroad. The U.S. is already popular with students from predominantly Anglophone countries, such as Nigeria and Ghana. These two countries stand out, but other promising source countries include Kenya and Ethiopia, as well as Egypt and Morocco. However, there is still strong competition, including from other Western countries, emerging destinations further afield (such as China and Malaysia), and even destinations within Africa, such as South Africa. Many of these competing destinations have existing cultural and economic ties. For example, many students from predominantly Francophone African countries, such as Cameroon and Senegal, go to France. But there is still room for U.S. institutions to make inroads across the continent.
A promising future?
For now, the U.S. appears to be on an upward trajectory of growth, particularly as the COVID-19 pandemic continues to fade from recent memory. Even as growth from China slows, the tremendous growth particularly from South Asia will buoy U.S. international enrollment. U.S. higher education also continues to benefit from a large and incredibly diverse set of thousands of universities and colleges with unique program offerings, setting it apart from virtually all other higher education systems. Additionally, U.S. institutions have significantly more capacity to absorb international students, considering that only about 6 percent of U.S. enrollment is international, according to Open Doors [11].
As always, potential disruptions remain on the horizon. These include the outcome of the 2024 U.S. presidential election [34], which as of now appears to be headed for a rematch between President Joe Biden and former president Donald Trump, who each take dramatically different approaches to immigration, education, global affairs, and international students. And as always, conflict, tensions, and other disruptions occur around the world that could impact enrollment suddenly and dramatically, or more subtly and over a longer span of time.
But for now, the future looks bright.
1. [35] Open Doors is an annual census of international student (those on a nonimmigrant student visa) enrollment in U.S. higher education institutions, as well as U.S. students who studied abroad two academic years prior.
2. [36] Open Doors always tracks data from the previous full academic year.
3. [37] Data for 2023 are not yet available on the IIE Project Atlas website [38] and were only report in the online briefing for the release of Open Doors 2023. The most recent available data on the Project Atlas website is for 2022.
4. [39] In Open Doors, IIE bundles South Asia and Central Asia together. The latter includes former Soviet republics such as Kazakhstan and Uzbekistan, which send relatively small numbers of students to the U.S.
5. [40] For more on these countries, please see the WES country profiles for each on WENR: Bangladesh [41], India [42], Nepal [43], and Pakistan [44].